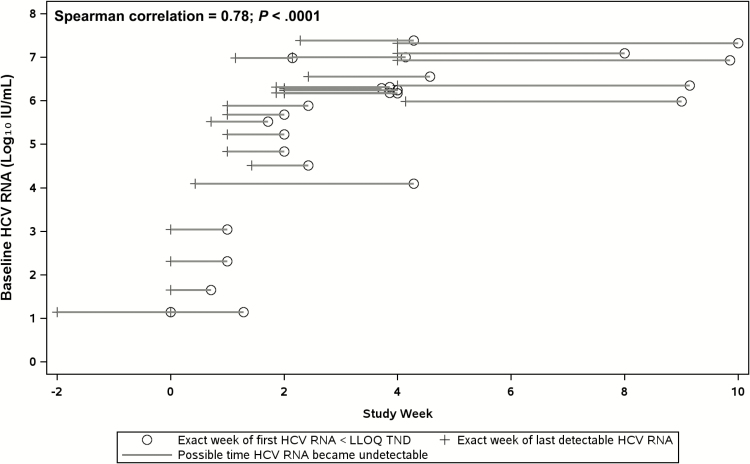
Figure 2.
Time to achieve an undetectable HCV RNA load, according to baseline HCV viral load. The horizontal axis represents the study week and the vertical axis represents HCV RNA load log10 IU/mL. The crosses indicate the last time each participant had a detectable HCV RNA load; the open circles show the times of the first undetectable HCV RNA loads; the lines represent the range of possible times when a participant may have become undetectable. Abbreviations: <LLOQ TND, less than lower limit of quantification target not detected; HCV, hepatitis C virus.

