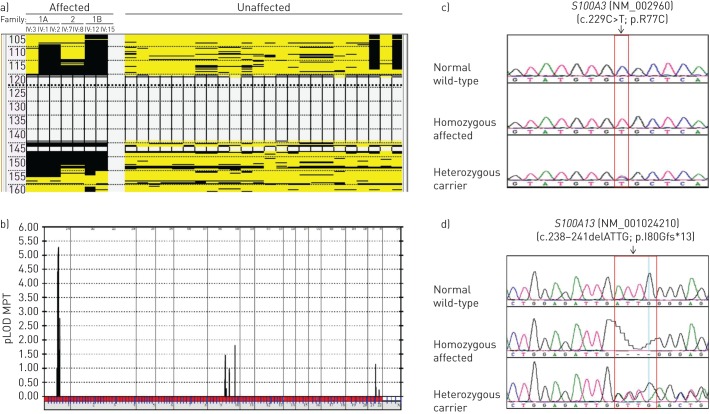
FIGURE 2.
Molecular analyses in pulmonary fibrosis of Families 1(A and B) and 2. a) A single run of homozygosity as a result of homozygosity mapping shared by all seven affected patients between rs10802117 and rs11808053 confirming linkage analysis. In addition, a total of 24 unaffected family members displayed no homozygosity for this region of interest. b) Linkage analysis using a total of 17 individuals (seven affected and 10 unaffected) from the two families resulting in a peak where the maximum multipoint parametric logarithm of the odds score (pLOD MPT) was 5.28, corresponding to chromosome 1p12-q21.3 on the x-axis. c, d) Sequence chromatograms indicating the wild-type, homozygous affected and heterozygous carrier forms of c) the C to T transition at position c.229 changing the arginine residue to cysteine at position 77 of the S100A3 protein (c.229C>T; p.R77C) and d) the c.238–241delATTG (p.I80Gfs*13) in S100A13. Mutation name is based on the full-length S100A3 (NM_002960) and S100A13 (NM_001024210) transcripts.

