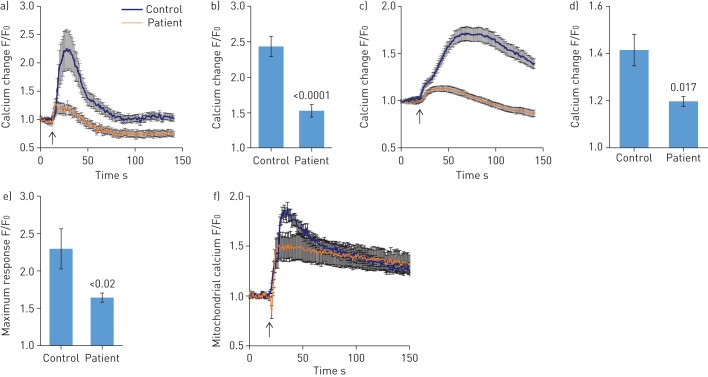
FIGURE 4.
Effect of S100A3 and S100A13 mutations on intracellular calcium changes. a) Intracellular calcium changes following stimulation of cultured skin fibroblasts isolated from a healthy control or a patient. Cells were stimulated with bradykinin (50 µM) (arrow). b) The histograms show maximum response to bradykinin. Experiments were performed on live single cells using confocal laser scanning microscopy. Data are expressed as mean±sem (n=23 and 24 for control and patients cells, respectively). Data are expressed as normalised fluorescence intensity ratio (F/F0) relative to the averaged three images obtained prior to the addition of the stimulus and are representative of three independent experiments. c, d) Fibroblast growth factor-2 (10 ng·mL−1)-stimulated cells, with results presented similar to a) and b). Data are expressed as mean±sem (n=10 and 7 for control and patient cells, respectively). Data are representative of 116 and 102 cells used in eight and 12 independent experiments from patient and control fibroblasts, respectively. e) Relative maximum calcium response to ionomycin (2 µM) in skin fibroblasts from controls and patients. Data are expressed as mean±sem (n=28 and 17 for control and patient cells, respectively). f) Mitochondrial calcium changes following stimulation of skin fibroblasts isolated from a healthy control or a patient with bradykinin (50 µM). Arrow indicates addition of bradykinin. Experiments were performed in live single cells using confocal laser scanning microscopy. All data are representative of cells isolated from two patients from the two unrelated families and two controls. p-values are indicated.

