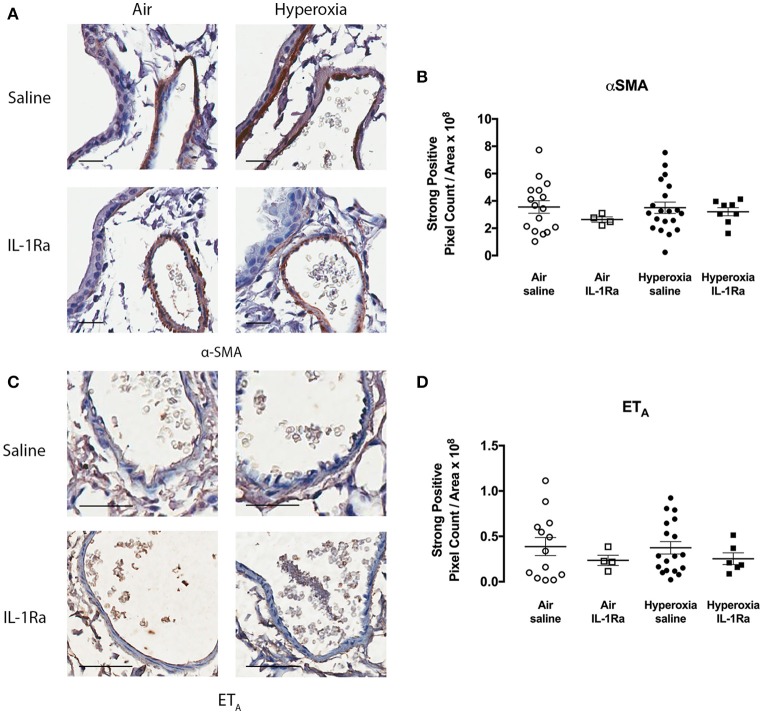
Figure 4.
α-SMA and ETA abundance in pulmonary arteries is not altered following hyperoxia. Immunohistochemistry for α-SMA and ETA was performed in lung sections from the air vehicle and hyperoxia vehicle groups. Each representative image for α-SMA (A) shows an airway on the left and an artery on the right. Scale bars = 100 μm. Representative images for ETA (C) show an artery only. Scale bar = 50 μm. Staining was analyzed using the Aperio positive pixel count algorithm and expressed as intensity of strongly positive staining divided by area (μm2) for α-SMA (B) and ETA (D). Data are shown as mean ± SEM, n = 13–20 mice per group.

