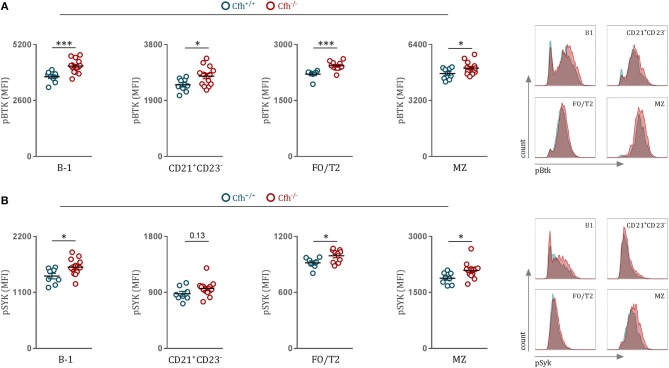
Figure 2.
CFH deficiency leads to heightened B cell receptor signaling in vivo. (A,B) Dot plots and representative flow cytometry plots show the MFI for (A) pBTK and (B) pSYK levels of B-1, CD21+CD23−, FO/T2, and MZ B cells (as defined in Figure 1A) of Cfh+/+ (blue dots) and Cfh−/− (red dots) mice. Data shown are pooled from four independent experiments. All results show mean ± SEM, each symbol represents an individual mouse, *p < 0.05, ***p < 0.001 (unpaired t-test).

