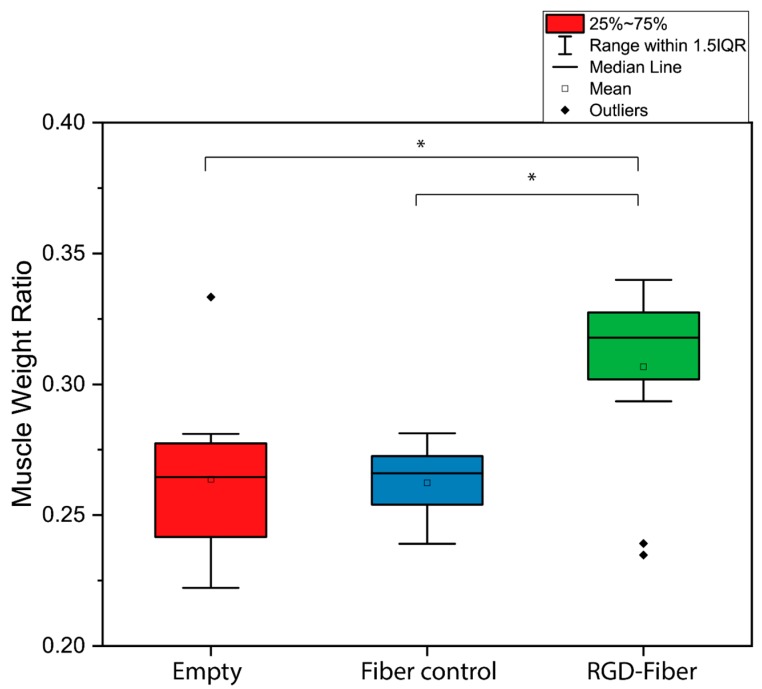
Figure 5.
Muscle weight ratio at week 6. The RGD-fiber group had significantly less atrophy compared to the control fiber and to the empty conduit groups (p = 0.045 and p = 0.020). Significant differences were not found between the control fiber and the empty conduit groups. Outliers in the empty group (muscle weight ratio = 0.33) represented a conduit with nerve tissue formation via gross evaluation. (* denotes p < 0.05).

