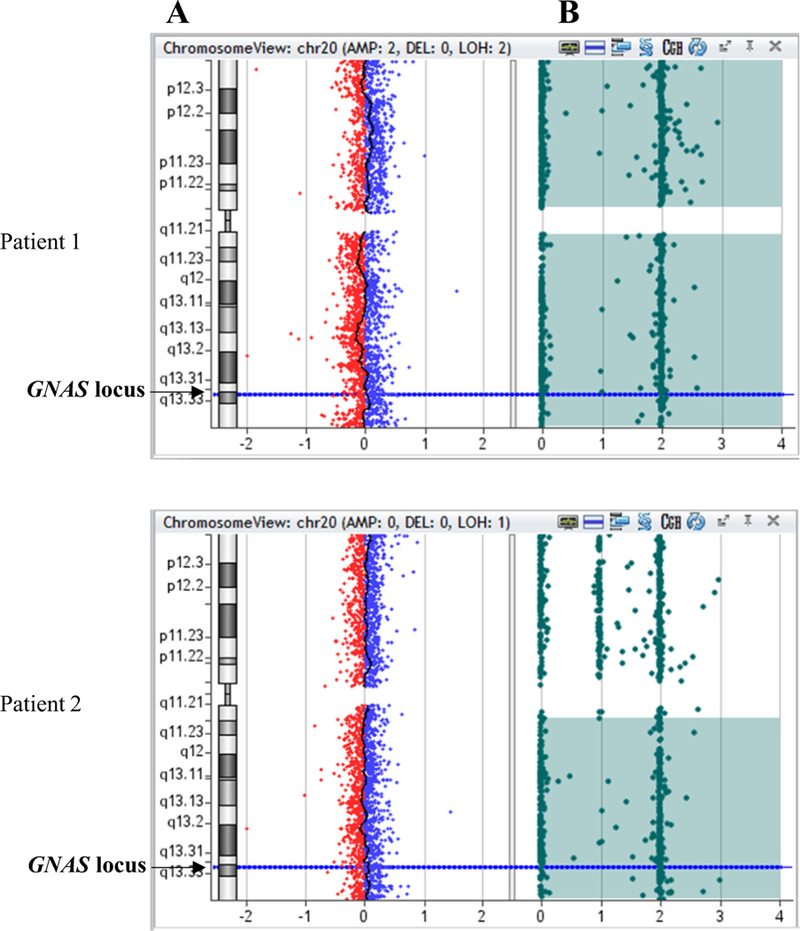
Fig. 1.

CGH/SNP-array in two patients presenting upd(20)pat (patient 1) or upd(20q)pat (patient 2). A: copy number, the X-axis represents the normalized log2 ratio Cy5(patient)/Cy3(healthy control) fluorescence intensity thresholds – 1 (loss) and 1 (gain), while the Y-axis represents the chromosome 20; B: SNP array; each SNP probe (represented by a filled circle) at a given locus can exist either in homozygous state (a single allele at 0 or 2) or in heterozygous state (at 1). Homozygosity is demonstrated by probes present at either 0 or 2 and the absence of probes at 1.
