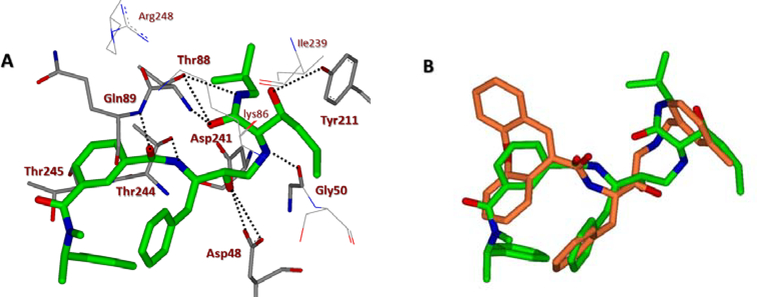
Figure 6.
(A) An energy-minimized model of inhibitor 2d (carbon chain, green) bound in the BACE2 active site. All strong hydrogen bonding interactions are shown as dotted lines. (B) Overlay of inhibitor 2d model with the X-ray crystal structure of hydroxyethylamine transition state inhibitor (carbon chain, orange) in BACE2 active site (PDB : 2EWY). The docking was performed with AutoDock Vina (see SupplementaryInformation for details).

