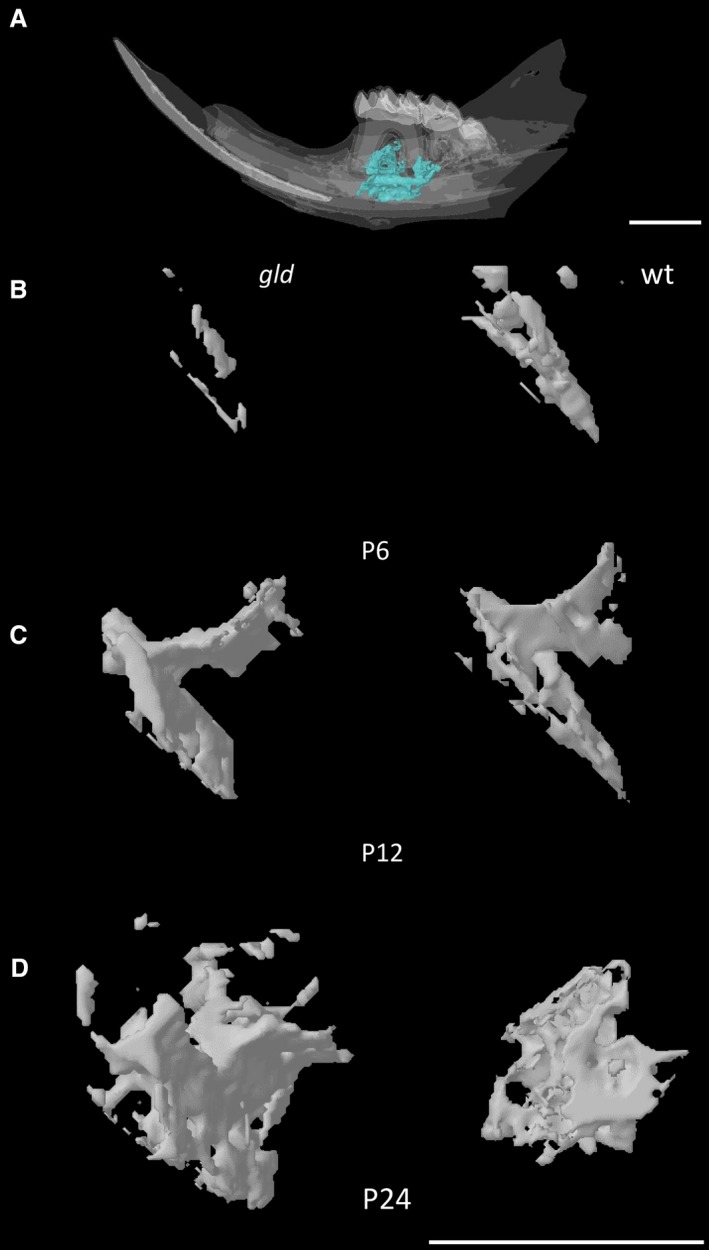
Figure 2.

Micro‐CT reconstruction of the analysed mandibular/alveolar bone. Representative 3D reconstruction images of a P24 WT mandible showing the region of interest (A), Representative 3D reconstructions of the mandibular/alveolar bone below the first molar as observed in gld and control mice at P6 (B), 12 (C) and 24 (D). Scale bar: 1 mm.
