Fig. 2.

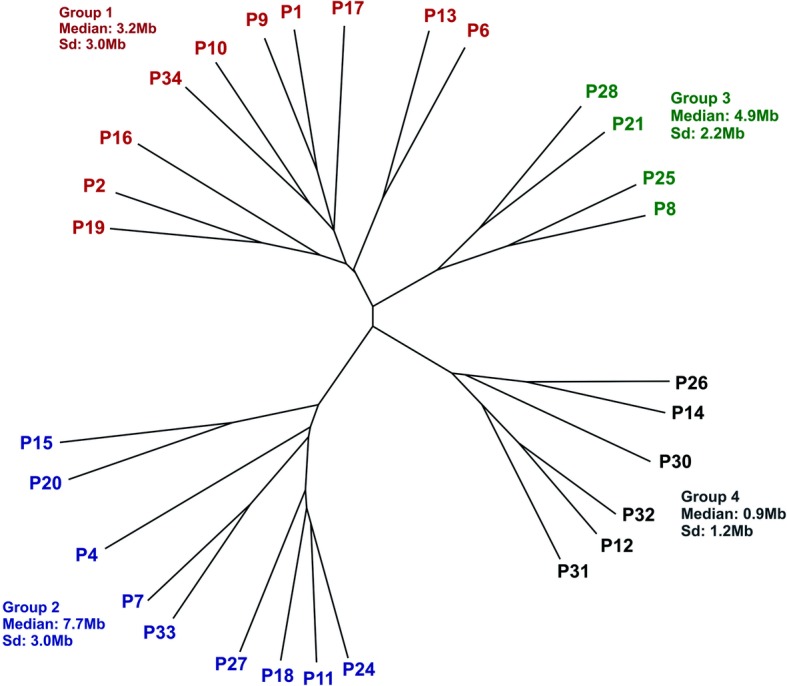
Hierarchical clustering dendrogram graphic showing the formation of four clusters of individuals according to their comorbidities. The range of deletion size is summarized for each group. Sd standard deviation

Hierarchical clustering dendrogram graphic showing the formation of four clusters of individuals according to their comorbidities. The range of deletion size is summarized for each group. Sd standard deviation