
Figure 5.
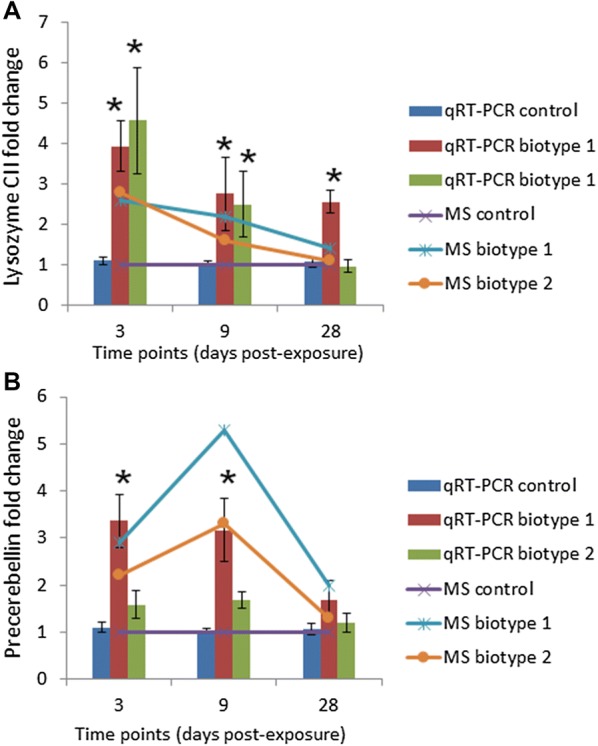
Comparison of transcriptional analysis and MS-based proteomic results of lysozyme C II and precerebellin. The qRT-PCR and the MS-based proteomic results are presented by the bar and line charts, respectively. Stars indicate statistically significant differences in the fold change compared to the control group. Error bars indicate standard deviation (n = 9). A Lysozyme C II, and B precerebellin-like protein.