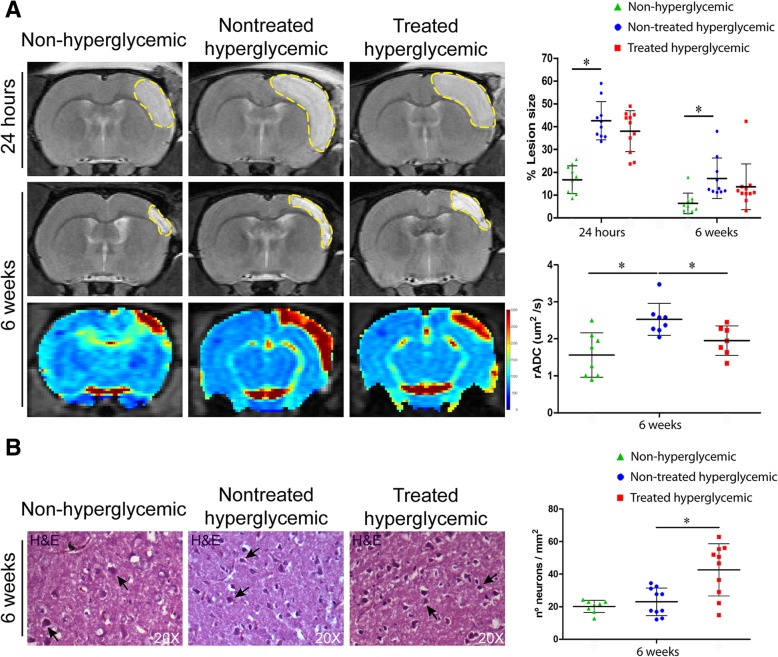
Fig. 3.
a MRI analysis. Representative T2-weighted MRI at 24 h and 6 weeks and rADC images at 6 weeks post-stroke. At 24 h and 6 weeks post-stroke, quantitative graphs of T2-weighted MRI showed a significantly higher lesion size in the hyperglycemic group compared with the non-hyperglycemic group. At 6 weeks post-stroke, the non-hyperglycemic and the treated hyperglycemic groups in the rADC images showed lower diffusion coefficients compared with the hyperglycemic rats (n = 10 animals per group). b Histopathological analysis. Representative H&E staining images in the cortex at 6 weeks. A significant increase in the number of surviving neurons was observed in the hyperglycemic treated group compared to the nontreated hyperglycemic group. (3 animals per group, 4 sections in each animal per group). Data are shown as mean ± SD. *p < 0.05. Abbreviations: MRI: magnetic resonance imaging; rADC: relative apparent diffusion coefficient; H&E: hematoxylin and eosin

