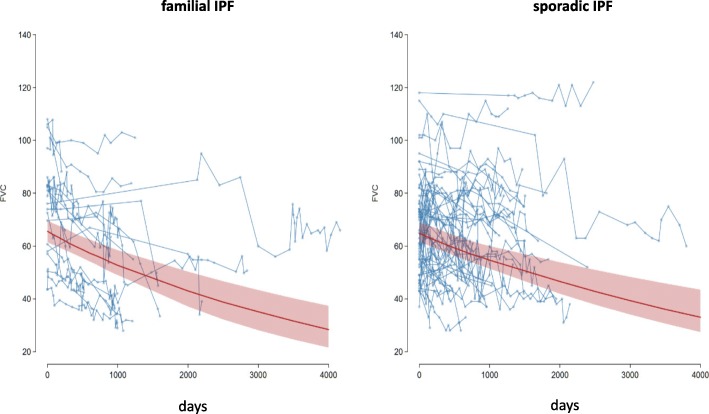
Fig. 1.
Decline of forced vital capacity (FVC) over time in both groups. Abbreviations: Patients with f-IPF, n = 21; s-IPF patients, n = 54. Day 0 corresponds to the first lung function test and approximately to the day of the first diagnosis. Each line represents the FVC course of a one patient; the points on the lines mark the individual values of FVC. Red trend line: Interpolated mean percent FVC decline of all patients; red area shows 95% confidence band for model prediction

