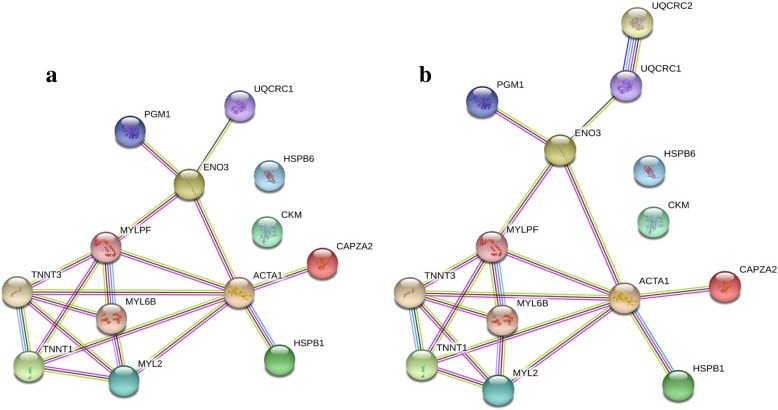
Fig. 5.
Graphs showing the interaction networks of differentially (P < 0.05) phosphorylated proteins in DFD and control meats, according to STRING confidence view. a) STRING network view only for differentially phosphorylated proteins identified in the present study (specific settings: number of interaction to show, zero in the first and the second shell). b) The same interaction networks adding other directly interacting proteins (specific settings: number of interaction to show, one in the first shell and zero in the second shell). The network nodes (circles) are phosphoproteins and the edges show known or predicted functional associations (threshold: 0.4, medium confidence interval). Colored lines between the phosphoproteins indicate the various types of interaction evidence (blue line: co-occurrence; light blue line: database evidence; black line: coexpression; green line: neighborhood evidence; purple line: experimental evidence; red line: fusion evidence; yellow line: text mining evidence)

