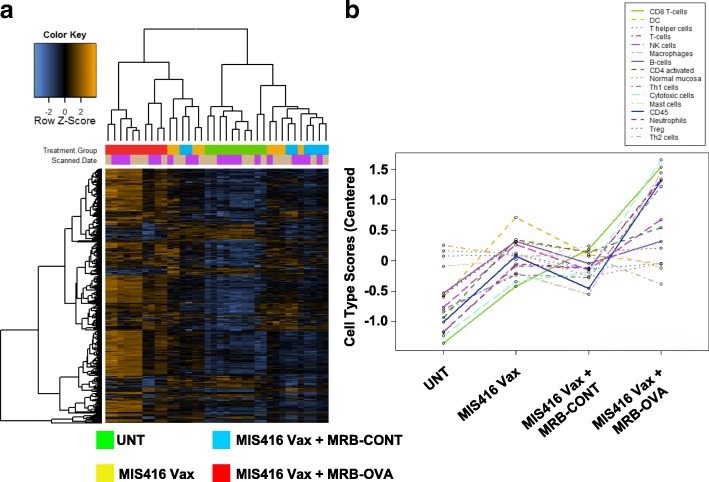
Fig. 4.
Tumor immune profiling reveals a unique gene signature of tumor targeted prime/boost therapy a Hierarchical cluster analysis of intratumoral transcriptional changes between treatment group (FDR < 0.1) (n = 8–10). b Immune cell profiling across treatment group (n = 8–10). All analysis was performed using the nCounter Immune Profiling Advanced Analysis plugin for nSolver

