Fig. 2.
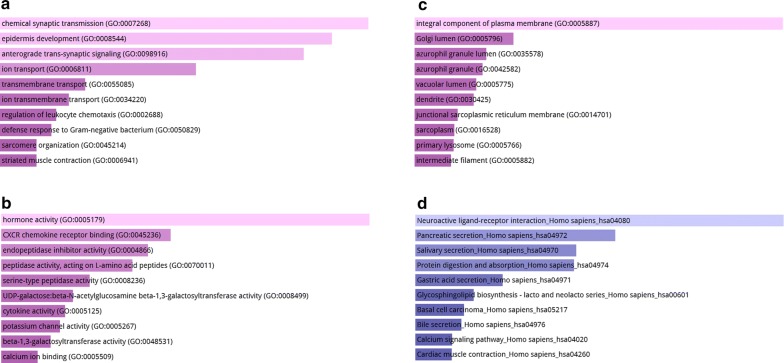
GO function analysis and KEGG pathway enrichment analysis between non-cirrhotic HCC and cirrhotic HCC. a Biological process (BP) analysis; b cellular component (CC) analysis; c molecular function (MF) analysis; d KEGG pathway enrichment analysis of differential expressed genes between non-cirrhotic HCC and cirrhotic HCC

