Fig. 1.

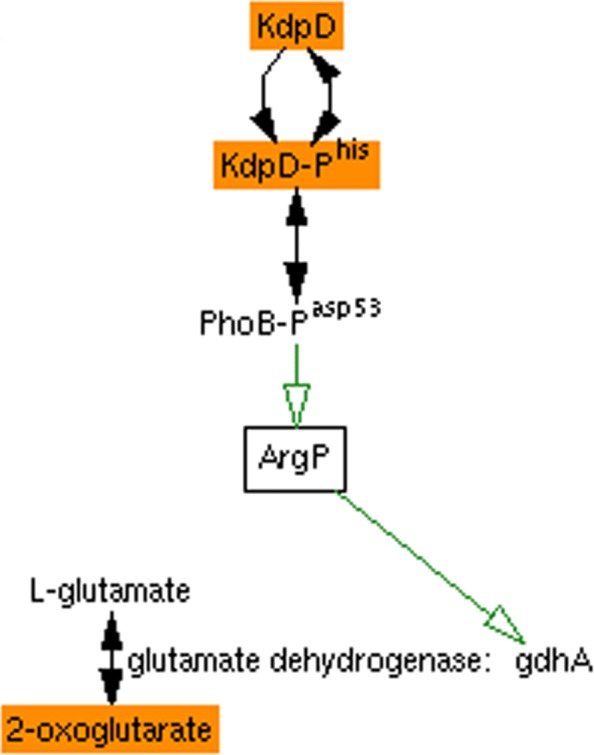
A diagram generated by the MultiOmics Explainer suggesting a path by which E. coli KdpD affects 2-oxoglutarate (both shown in orange). Green arrows represent activation, and black arrows represent chemical reactions

A diagram generated by the MultiOmics Explainer suggesting a path by which E. coli KdpD affects 2-oxoglutarate (both shown in orange). Green arrows represent activation, and black arrows represent chemical reactions