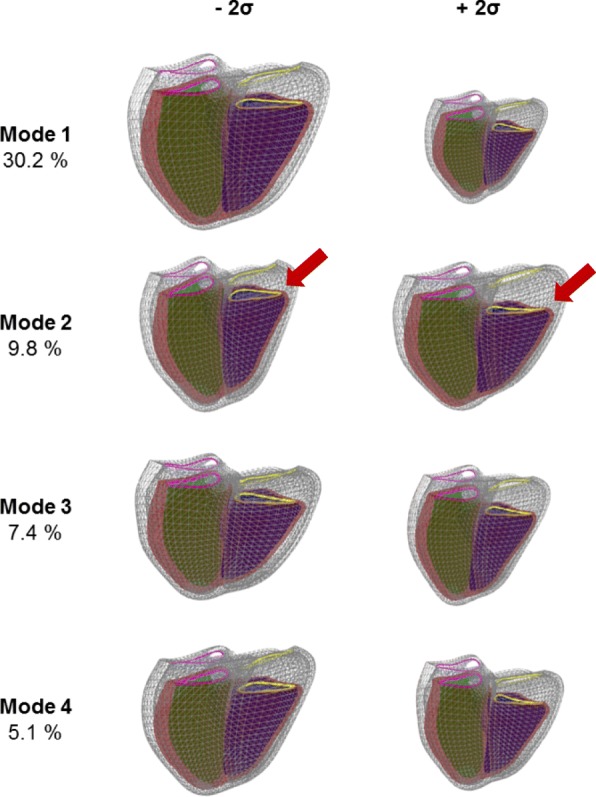
Fig. 4.

First four components of variation for the combined end-diastole (ED) and end-systole (ES) atlas. The ED is shown in wireframe and the ES in solid mesh. The right ventricle is shown in blue, the LV in green and the LV epicardium in red. The mitral valve is shown in pink and the tricuspid valve in yellow. The red arrow shows changes in the motion of the tricuspid valve. The left and right shapes of each mode correspond to the mean ± 2 std. dev. Animations of these shape components have been provided in the Additional file 1: Figure S2
