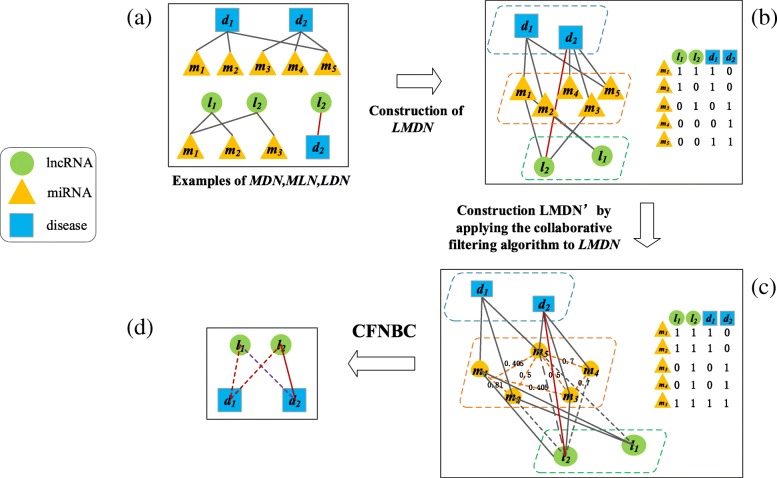
Fig. 6.
Flowchart of CFNBC. In the diagram, the green circles, blue squares, and orange triangles represent lncRNAs, diseases and miRNAs respectively. a construction of MDN, MLN and LDN; (b) construction of the original tripartite network LMDN and its corresponding adjacency matrix; (c) construction of the updated tripartite network LMDN′ and its corresponding adjacency matrix; (d) prediction of potential lncRNA-disease associations through applying the naïve Bayesian classifier on LMDN′

