. 2018 Mar 8;10(15):6900–6910. doi: 10.1039/c7nr08614h

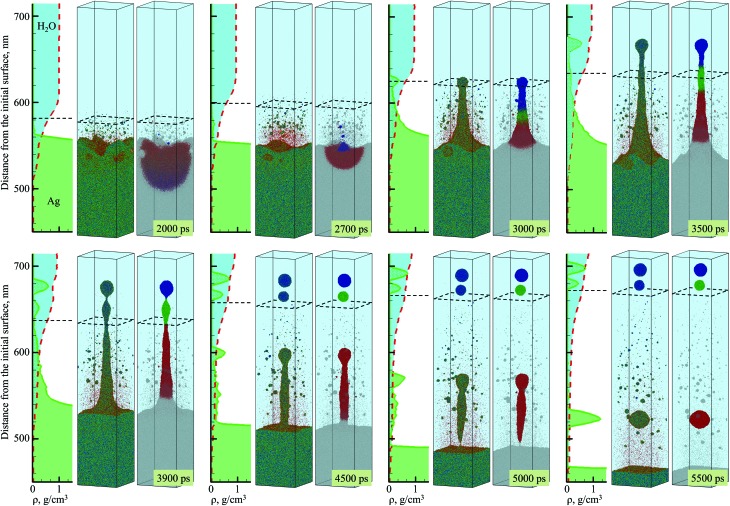
Fig. 2. Snapshots of atomic configurations and density distribution predicted in atomistic simulation of laser ablation of a bulk silver target irradiated in water by a 10 ps laser pulse at an absorbed fluence of 600 mJ cm–2. Only a part of the computational system from 450 to 715 nm with respect to the initial surface of the silver target is shown in the figure. Two representations of atomic configurations are provided for each moment of time. On the left side of the paired snapshots, the atoms are colored according to their potential energies, from blue for the crystalline nanoparticles, to green for molten Ag, and to red for individual Ag atoms. On the right side of the paired snapshots, the atoms are colored based on IDs of three nanoparticles generated through the rupture of the liquid nanojet (each color except grey corresponds to atoms that end up in one of the three nanoparticles). The molecules representing water environment are blanked and the presence of water is illustrated schematically as a bright blue region above the Ag target. The degree of water-silver mixing is illustrated by density plots shown as functions of distance from the substrate for both water and silver to the left from the corresponding snapshots; the red dashed line and light blue fill color represent water density distribution, the green solid line and light green fill color represent Ag density distribution. The black dashed squares in the atomistic snapshots and the horizontal dashed lines in the density plots show approximate positions of the diffuse “boundary” between the dense water and low-density mixing region defined here as the position where the water density is 0.6 g cm–3.

Fig. 2