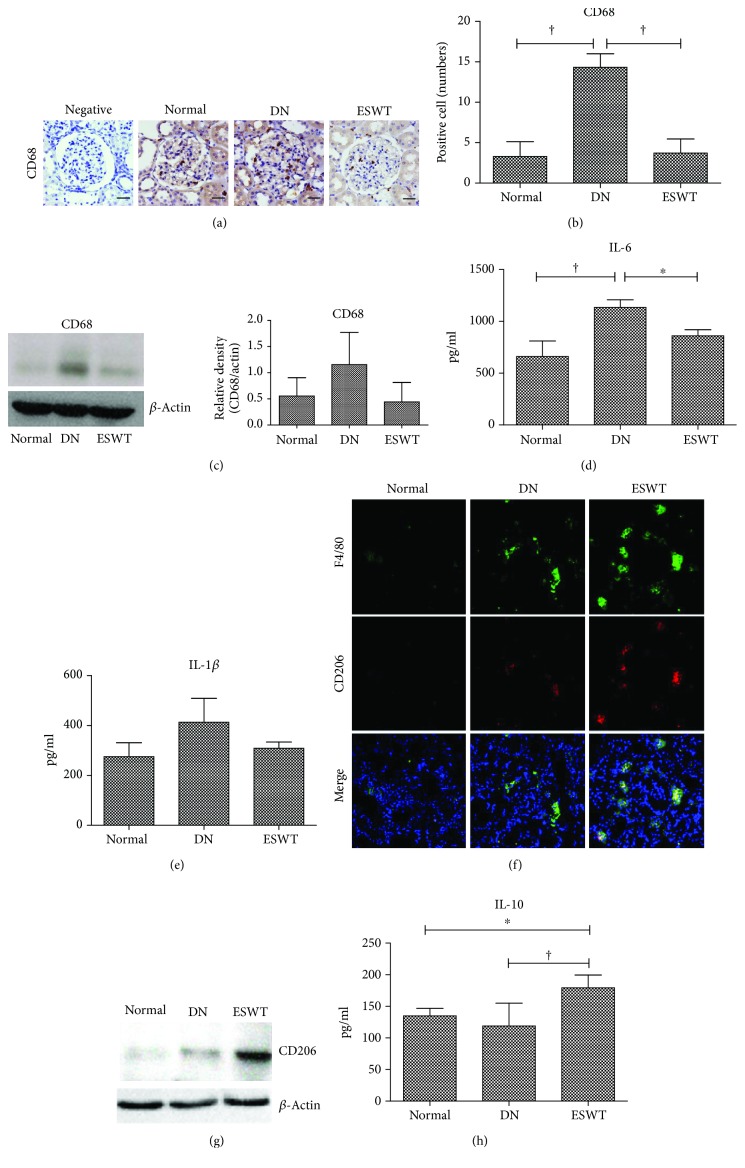
Figure 3.
Low-energy ESWT prevented diabetes-induced renal inflammation. (a, b) Representative images of renal tissue immunohistochemistry stained with CD68 indicating macrophage infiltration and quantification of immunohistochemistry staining by image analysis; bar = 30 μm. (c) Western blot analysis CD68 expression in renal tissue and quantification of western blot by densitometric analysis. (d, e) Renal expression of inflammatory mediators IL-6 and IL-1β. (f) Representative images of renal tissue immunofluorescence stained with F4/80 (green) and CD206 (red) indicating anti-inflammatory M2 macrophages. (g) Renal expression of anti-inflammatory M2 macrophage marker CD206. (h) Renal expression of anti-inflammatory mediator IL-10. † P < 0.01 and ∗ P < 0.05 (N = 6–10).

