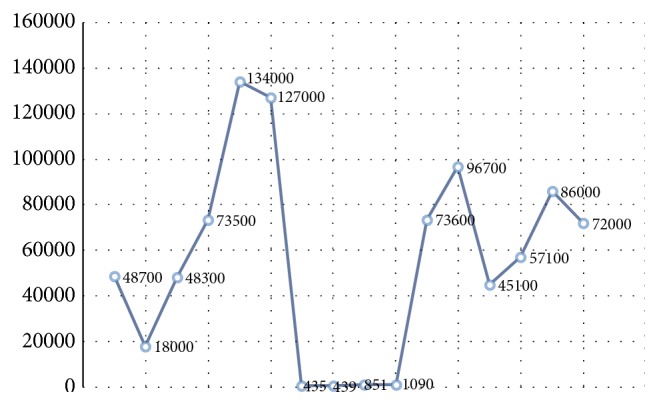
Figure 3.

Comparison between IgE levels during application of omalizumab. The y-axis: serum IgE expressed in IU/ml; the x-axis: the dates on which these levels were taken. The decrease in IgE levels was clearly observed during the application of omalizumab; these increased after treatment was discontinued.
