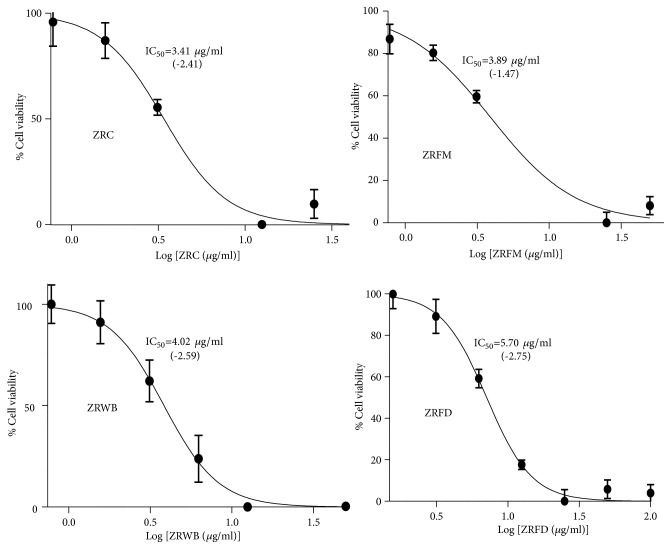
Figure 2.
Dose-response curves of selected fractions. The best-fit inverted logistic dose-response curves and corresponding IC50s were modelled from three distinct alamar blue assays. The crude extract and its fractions have Hill slopes less than -1 (shown in parentheses). ZR=Z. zanthoxyloides LZT, root; ZRC=crude extract of ZR; FD=Dichloromethane fraction; FM=methanol fraction; WB= butanol fraction.

