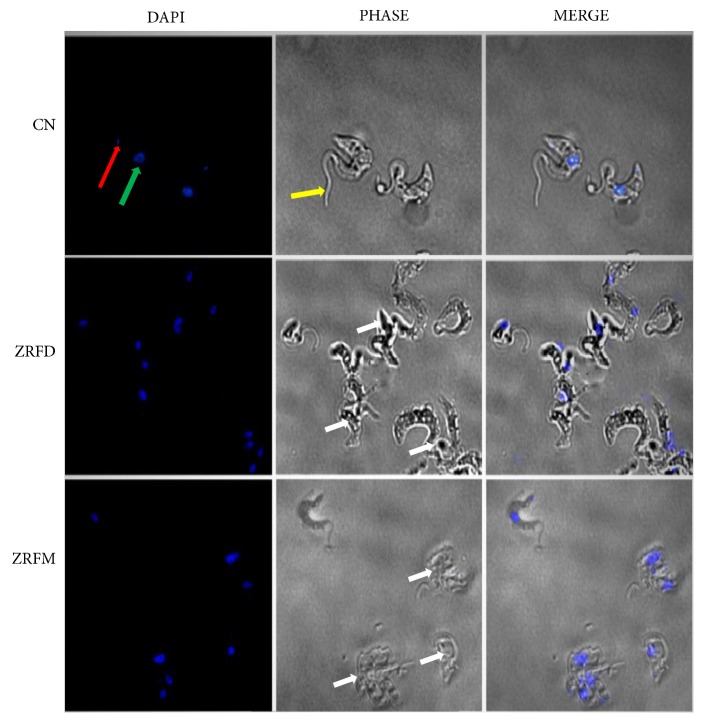
Figure 5.
Effect of selected fractions on cell morphology and structure of T. brucei. Cells were mostly distorted or clustered as compared to the negative control (white arrows). Red arrow=kinetoplast; green arrow=nucleus; yellow arrow=flagellum; ZR=Z. zanthoxyloides LZT, root; FD=Dichloromethane fraction; FM=Methanol fraction; CN=Negative control.

