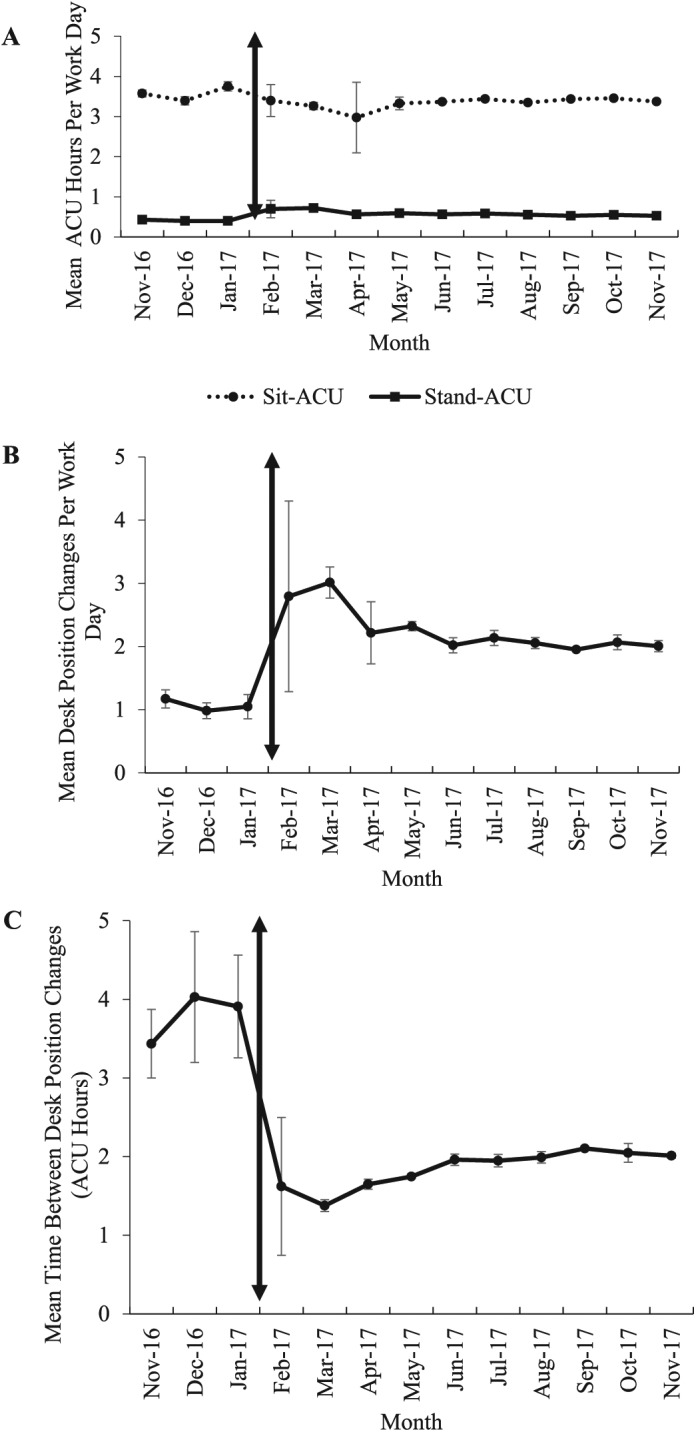
Figure 1.

Overall pooled outcome measure means for all workers by each month. The double-arrowed vertical line represents the start of the intervention. Means of Sit/Stand-ACU (A), Desk position changes per work day (B), and Time between desk position changes (C) show health behavior change for each outcome measure. Data from company holiday period (January 1, 2017–January 7, 2017) was excluded for these graphs. Error bars indicate 95% confidence intervals.
