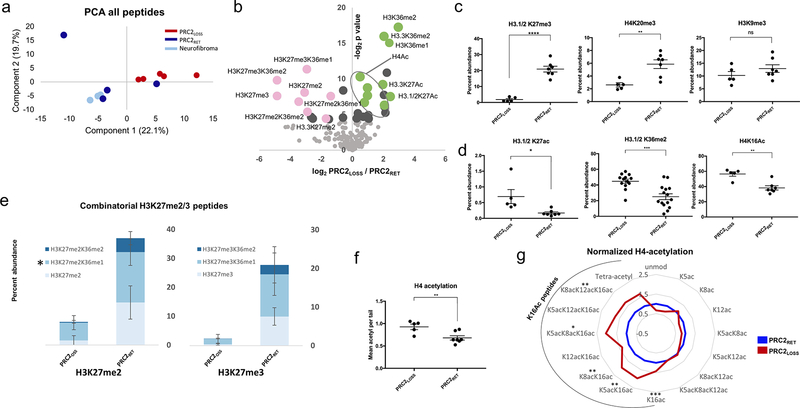
Figure 2.
Global analysis of histone PTMs reveals extensive changes associated with PRC2 loss. A, Principal component analysis (PCA) of global histone PTMs in MPNST with PRC2 loss (PRC2LOSS; 5 replicates; red), MPNST with retained PRC2 function (PRC2RET; 4 replicates; blue), and benign neurofibromas (3 replicates; light blue). B, Volcano plot illustrating differential histone PTMs in all samples as a function of PRC2 status. The log2-fold change in abundance (PRC2LOSS/PRC2RET) is plotted along the x-axis and the −log2 P value is plotted on the y-axis (P = 0.05 corresponds to 4.32). Individual modifications are highlighted with labels. Pink dots, peptides with PRC2-mediated modifications; green dots, modifications typically associated with active transcription. Quantitative comparison of individual histone PTMs between PRC2LOSS and PRC2RET samples, marks associated with transcriptional repression (C) or transcriptional activation (D). E, Stacked bar plots depicting combinatorial modifications for the peptides containing H3K27me2 (left) and H3K27me3 (right). Darker shades of blue indicate higher levels of coexisting methylation at H3K36. PRC2RET and PRC2LOSS samples are depicted with separate stacked bars. For the 27–40 peptide, the quantification of K27me2/K36me1 also includes K36me3 (*), because these peptides were not reliably distinguished in this dataset. Bar and dot plot of total H4K16Ac levels (F) and radar plot depicting all histone H4 acetylation states (G), normalized to levels in PRC2RET. The black arc highlights peptides containing H4K16Ac, PRC2LOSS (red), and PRC2RET (blue). For all panels, error bars are ± SD. ns, no significant change, two-tailed t test; *, P < 0.05;**, P < 0.01; ***·, P < 0.0001.

