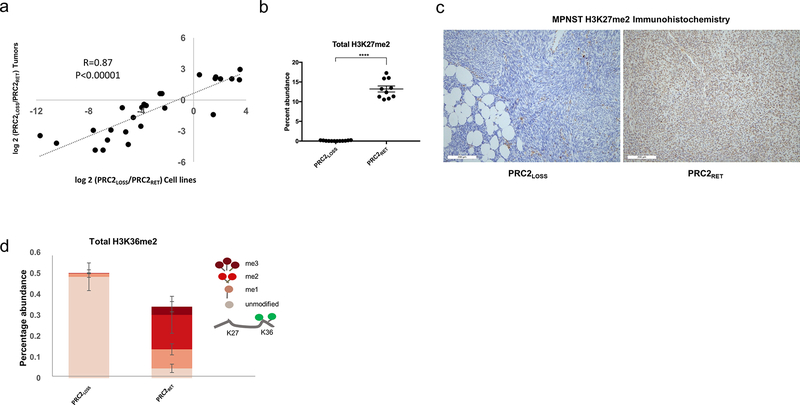
Figure 3.
MPNST cell lines validate the changes observed in human tumors and allow for more precise quantification of changes is H3 PTMs. A, Correlation between changes in histone PTMs as a function of PRC2 status in cell lines (x-axis) and human tumors (y-axis) for peptides with significant changes in either comparison. P values for Pearson correlation are shown. B, Quantitative comparison of H3K27me2 levels between PRC2LOSS (12 replicates) and PRC2RET (10 replicates) samples. Two-tailed t test; ****, P< 0.0001. Using DIA acquisition, H3K27me2/1 and H3K36me3 could be distinguished, enabling more precise quantification of H3K27me2 levels. Error bars, ± SD. C, IHC for histone H3K27me2 in representative MPNST cases: PRC2LOSS (left) and PRC2RET (right). D, Quantitative comparison of H3K36me2 levels between PRC2LOSS (left) and PRC2RET (right) samples. The peptide quantifications are represented as stacked bar plots, with each level of methylation colored according to the schematic depicted at right, where higher levels of methylation at K27 lead to progressively darker red colors. Unpaired t test, P < 0.0001 for pairwise peptide comparisons at the same level of methylation. Error bars, ± SD.

