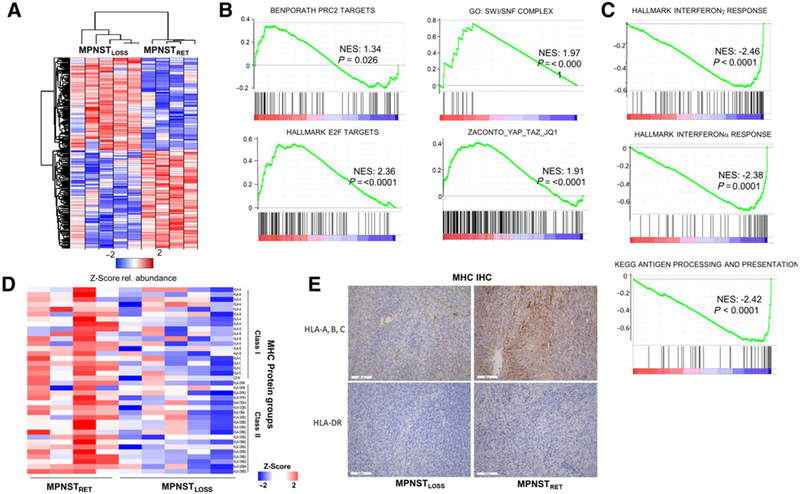
Figure 4.
Global proteomic analysis reveals PRC2 loss enhances tumor growth pathways and promotes immune evasion. A, Heatmap depicting Z-score for proteomic data, for proteins with P < 0.05 between conditions. B and C, GSEA for selected annotated gene sets run using the GSEA preranked tool, with all identified proteins ordered by differential expression between MPNSTLOSS versus MPNSTRET. Proteins showing increased expression in MPNSTLOSS have positive enrichment values and are shown in B. Those with decreased expression in MPNSTLOSS have negative enrichment values and are shown in C. NES, normalized enrichment score. D, Heatmap depicting Z-scores for all MHC protein groups identified across proteomic dataset, ordered with MPNSTRET (left) and MPNSTLOSS (right). Class I MHC proteins are at the top and class I are at the bottom. E, IHC staining for MHC class I (top) and MHC class II (bottom) from representative sections of MPNSTLOSS (left) and MPNSTLOSS (right). In MPNSTLOSS, HLA-A, B, C staining is largely confined to blood vessels, whereas in MPNSTRET, membranous staining is visible in tumor cells as well. MHC class II, represented with HLA-DR staining, is essentially absent in MPNSTLOSS, with only rare, positive-staining antigen-presenting cells. In MPNSTRET, these cells are more numerous. The IHC findings agree with the quantitative values seen across the dataset in the MS analysis.

