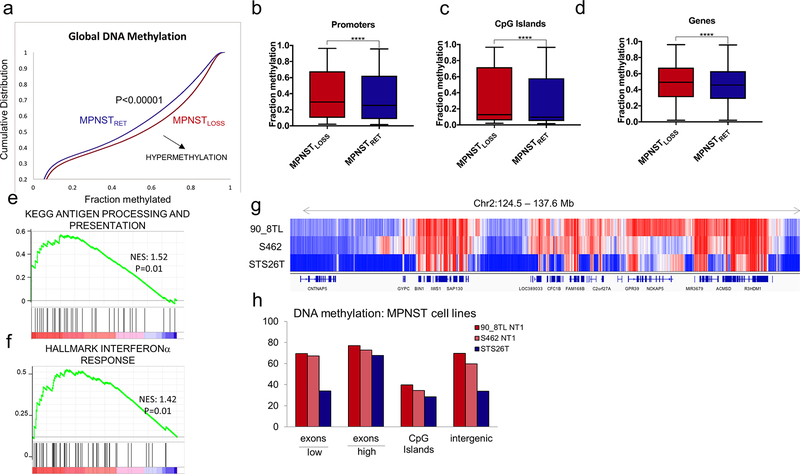
Figure 6.
MPNSTLOSS exhibit global DNA hypermethylation. A, Methylation array data (62) for MPNST tumors analyzed as a function of H3K27me3 status (loss, red; retained, blue). Cumulative distribution function for methylation B-values across all probes in the dataset. Shift of the curve toward the lower right indicates hypermethylation in MPNSTLOSS (P< 0.00001). B-D, Tukey boxplot of methylation B-values for probes within the specified genomic regions for MPNSTLOSS versus MPNSTRET. ****, P< 0.0001, two-tailed t test, all comparisons. E and F, GSEA for rank-ordered list of differentially methylated promoters (log2 MPNSTLOSS/MPNSTRET) queried against antigen presentation (E) and IFN response (F) gene sets previously shown to have decreased protein abundance in MPNSTLOSS. Nominal P values are shown. G and H, WGBS DNA methylation comparison of MPNSTLOSS and MPNSTRET cell lines. G, Visualization of DNA methylation of a representative genomic region containing expressed and unexpressed genes and intergenic regions illustrating genome-wide trends summarized in H. The methylation differences between MPNSTLOSS (90_8TL and S462) and MPNSTRET (STS26T) are least prominent in the expressed genes (designated as “high” with the bar below the x-axis) and CpG islands, and highest within silenced genes (designated as “low” with the bar below the x-axis) and intergenic regions, where global loss of K27me3 leads to replacement by DNA methylation.

