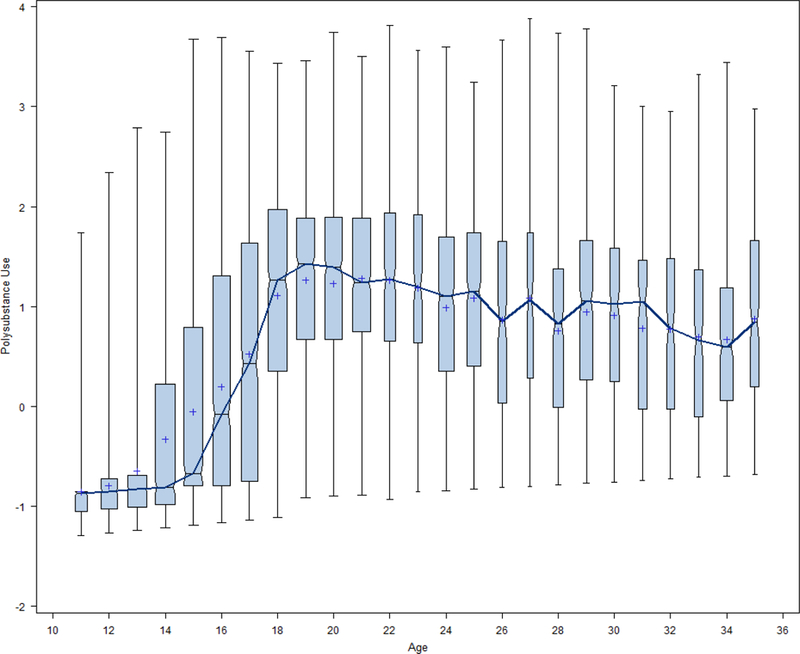
Figure 2.

Age-specific distributions of polysubstance use factor scores for the pooled sample.
Note: Box length represents inter-quartile range of scores; box width is proportional to sample size; the notch indicates the age-specific median; the plus sign the age-specific mean; the dark line connects the sample medians over time.
