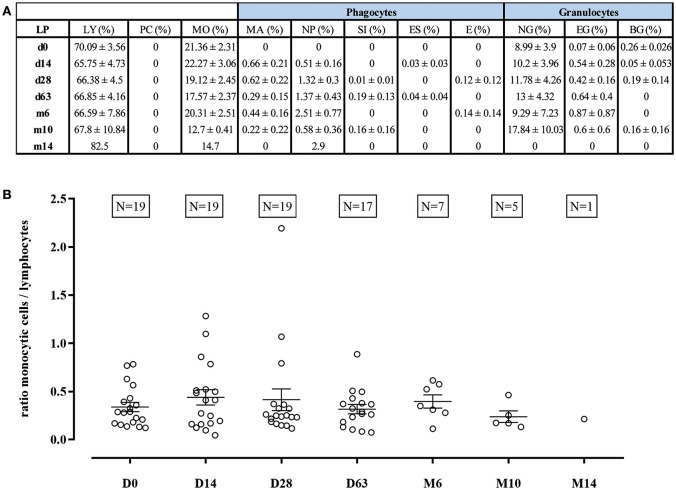
Figure 1.
Cell distribution of leukocyte subpopulations during treatment with nusinersen. Respective cell populations are given as proportion of total leukocytes in percentage with mean ± standard error of the mean (SEM) (A). Ratio between share of monocytic cells (including monocytes and different forms of macrophages termed as “phagocytes”) and lymphocytes is depicted at different time points of nusinersen therapy (B). Dot plots show mean ± SEM. LP, lumbar puncture; LY, lymphocytes; PC, plasma cells; MO, monocytes; MA, macrophages; NP, nusinophages; SI, siderophages; ES, erythrosiderophages; E, erythrophages; NG, neutrophil granulocytes; EG, eosinophil granulocytes; BG, basophil granulocytes.

