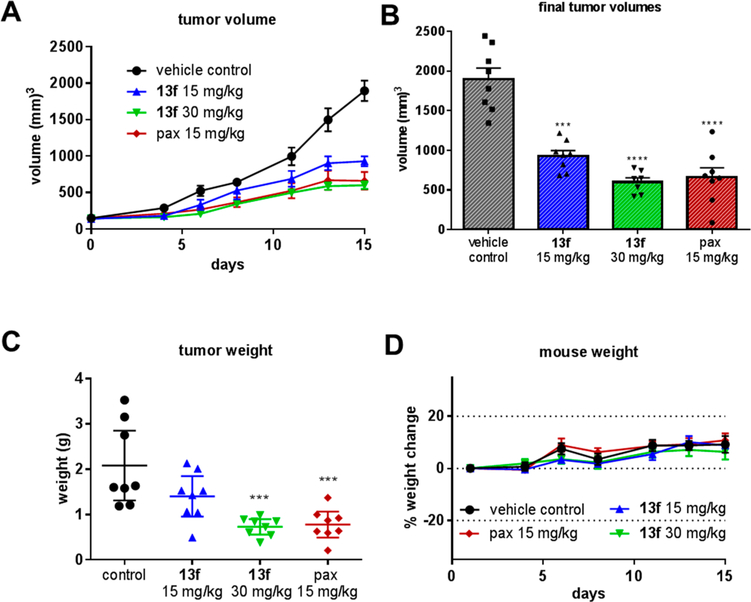
Figure 4.
Compound 13f inhibits tumor growth in vivo. (A) A375 xenograft model in nude mice. The graph represents mean tumor volume ± SEM (n = 8). (B) Individual tumor final volumes ± SEM. (C) Tumor weights ± 95% CI. Statistical significance for tumor volume and weight was determined by one-way ANOVA analysis followed by Dunnett’s multiple comparison test for the treatment group compared with the corresponding results of the control group. (D) Mouse body weights are represented as a percent of weight change compared to initial weight ± SEM (***p < 0.001, ****p < 0.0001).

