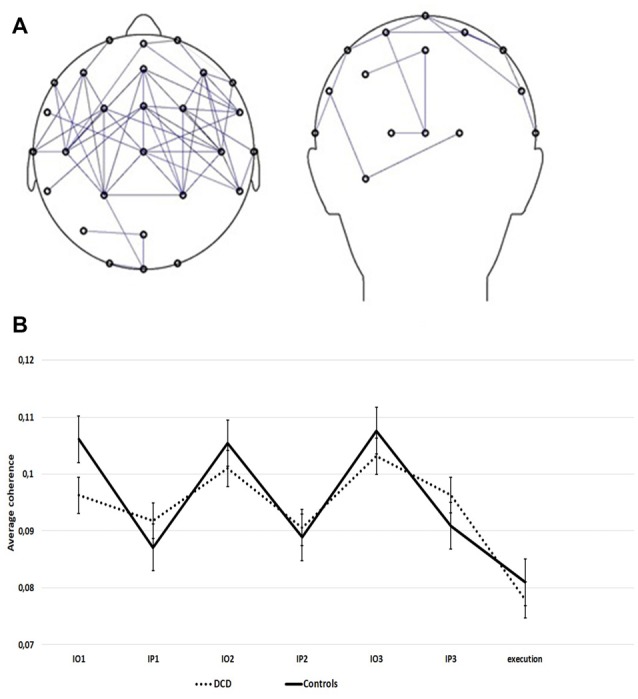
Figure 4.

(A) Fronto-parietal coherence network. Pairs of electrodes showing higher mu-frequency coherence during the observation of movement sequences than during the pause interval. Only electrode pairs with the largest normalized coherence effect (z < −1) are shown. (B) Average coherence within the observation network (z < −1) during the imitation task, for the DCD and control group (14 controls, 14 DCD). Data are presented separately for the repeated observation of motor sequences (IO1, IO2, IO3) and consecutive pause intervals following each sequence (IP1, IP2, IP3). Error bars represent SE.
