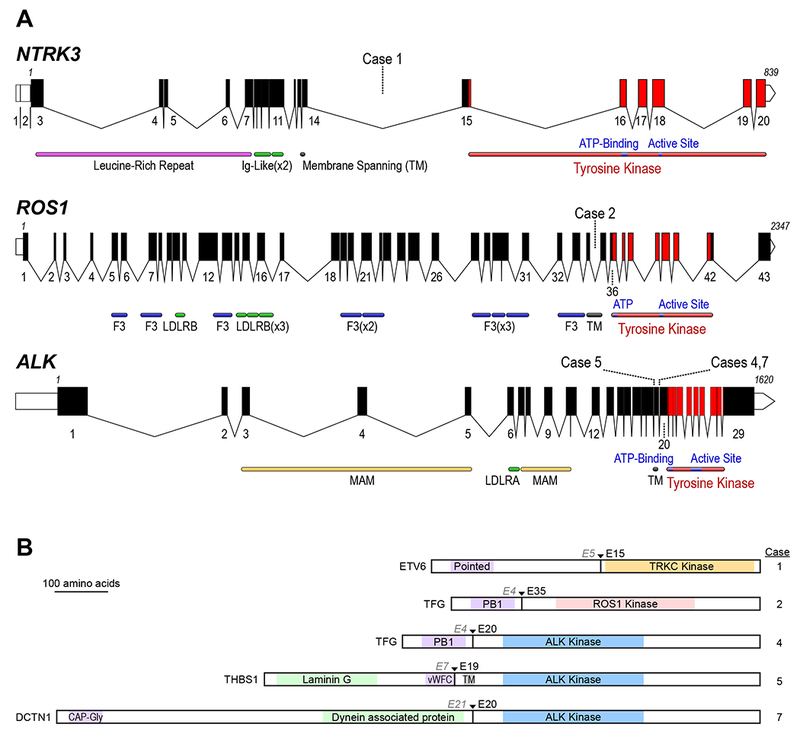
Figure 5:

A Schematic of the human ALK, ROS1, and NTRK3 loci. Exon numbers are shown below their respective boxes for RefSeq ALK transcript variant 1 (NM_004304.4), ROS1 (NM_006180.4), and NTRK3 transcript variant 1 (NM_001012338.2). Fusion breakpoints are shown as dotted lines for the indicated cases; all breakpoints are intronic. Note that the three schematics are not at the same scale (amino acid residue numbers are listed above first and last exons), exons are drawn at a larger scale than introns, and introns are not drawn to the same scale for each gene (ALK locus is ~739 kB, ROS1 is ~137 kB, and NTRK3 is ~384 kB). Domains LDLR: LDL Receptor (A/B); F3: Fibronectin type III; MAM: meprin, A-5, mu-receptor; TM: Transmembrane Helix). B: Schematic of predicted fusion protein products (see also Table 1). Triangles and Ex notation indicate the fusion breakpoints, preceding partner gene exon, and subsequent kinase exon. Purple shaded domains are those predicted or shown to induce dimerization or trimerization in the fusion partner (Pointed: sterile alpha motif (SAM) / helix loop helix (HLH) oligomerization domain; PB1: Phox and Bem1p interaction domain; vWFC von Willebrand Factor C domain; CAP-Gly: cytoskeleton-associated protein glycine-rich domain); Green shaded domains are other annotated sequence features. Gray shaded TM: transmembrane domain. Proteins are drawn to scale (DCTN1-ALK fusion = 1383 AA).
