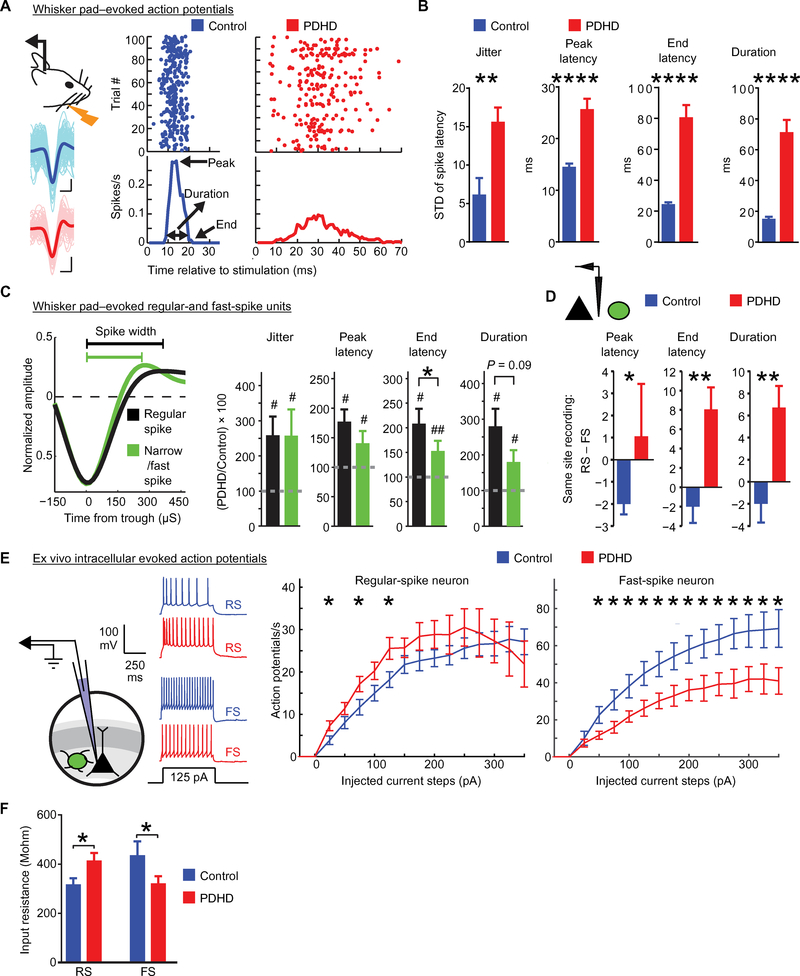
Fig. 6. Whisker pad-evoked single-unit firing and associated inhibition in PDHD mice.
(A) Left: Experimental design and example single-unit waveforms. The average waveform (darker color) is superimposed on 100 waveforms (lighter color). Scale bar, 500 μs/0.1 mV. Right: Example dot-raster plots depicting action potentials induced by whisker pad stimulation with the PSTH below. (B) Single-unit group data from control (n = 13 units, five mice) and PDHD (n = 10, four mice) illustrating jitter, peak latency, end latency, and duration of action potentials. (C) Left: Waveforms of broad regular spiking (putative excitatory) and narrow spiking (putative fast-spiking inhibitory) indicating the parameters (trough-to-peak time and half-widths) used to classify spikes into RS or FS. Right: Bar charts show RS (n = 11, black) and FS (n = 7, green) single units from PDHD mice normalized to the mean of the corresponding group in control. (D) RS and FS recorded simultaneously from the same electrode (schematic on acetate:glucose) in PDHD mice (n = 10 RS to FS pairs) and control (n = 4 RS to FS pairs). (E) Left: Diagram of narrow-tip (high-resistance) whole-cell patch clamp recording and traces obtained in response to a 125-pA step current in control (blue) and PDHD (red) neurons. Right: Population average for a number of action potentials elicited by current steps in regular-spiking (control, n = 9 cells, 7 mice; PDHD, n = 17 cells, 13 mice) and fast-spiking (control, n = 22 cells, 12 mice, PDHD n = 26 cells, 15 mice) cells from PDHD and control mice. (F) Population average input resistance in PDHD (n = 14 cells, 12 mice) and in control fast-spiking neurons (n = 8 cells, 7 mice) and regular-spiking neurons (PDHD, n = 16 cells, 10 mice; controls, n = 13 cells, 8 mice). Data indicate means ± SEM. Statistical differences were determined using two-tailed Student’s t test and two-way analysis of variance (ANOVA) with correction for multiple comparisons by controlling the false discovery rate with the Bengamini-Krieger-Yekutieli method. *P < 0.05, **P < 0.01, and ****P < 0.0001.

