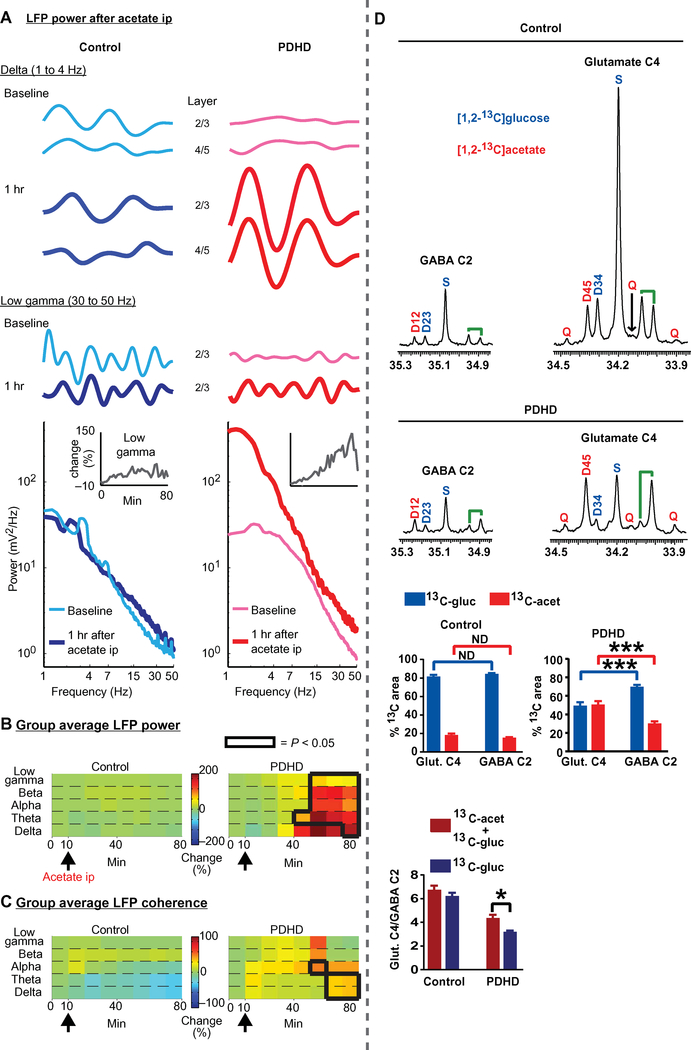
Fig. 8. Acetate enhancement of cortical activation and glutamate 13C labeling in PDHD mice.
(A) Top: Spontaneous LFP recordings from a low (delta frequency) and higher frequency bin (low gamma) before and 1 hour (hr) after an intraperitoneal (ip) injection (2 mg/g of body weight) of sodium acetate. Bottom: LFP power after acetate in a PDHD mouse. Inset: Temporal profile of gamma power after acetate administration (injected at 10 min). (B and C) LFP power and coherence mean percentage change (compared to pre-acetate baseline) for all mice (PDHD, n = 5; control, n = 5) after acetate (black arrow). Black lines in (C) and (D) enclose statistically significant regions (P < 0.05). (D) Representative spectra of glutamate C4 (glut. C4) and GABA C2 from PDHD and control mice. The contribution of 13C-acetate (13C-acet) [(area D45 + area Q)/total area] and 13C-glucose (13C-gluc)] [(area S + area D34)/total area] was calculated for both isotopomers. The graphs immediately below represent the contribution of acetate and glucose to glutamate and GABA in control (top) and PDHD mice (middle). The bottom graph depicts the contribution to glutamate:GABA ratio from acetate and glucose in control and PDHD mice. Data represent mean ± SEM. Statistical differences were determined using two-tailed Student’s t test. *P < 0.05 and ***P < 0.001.

