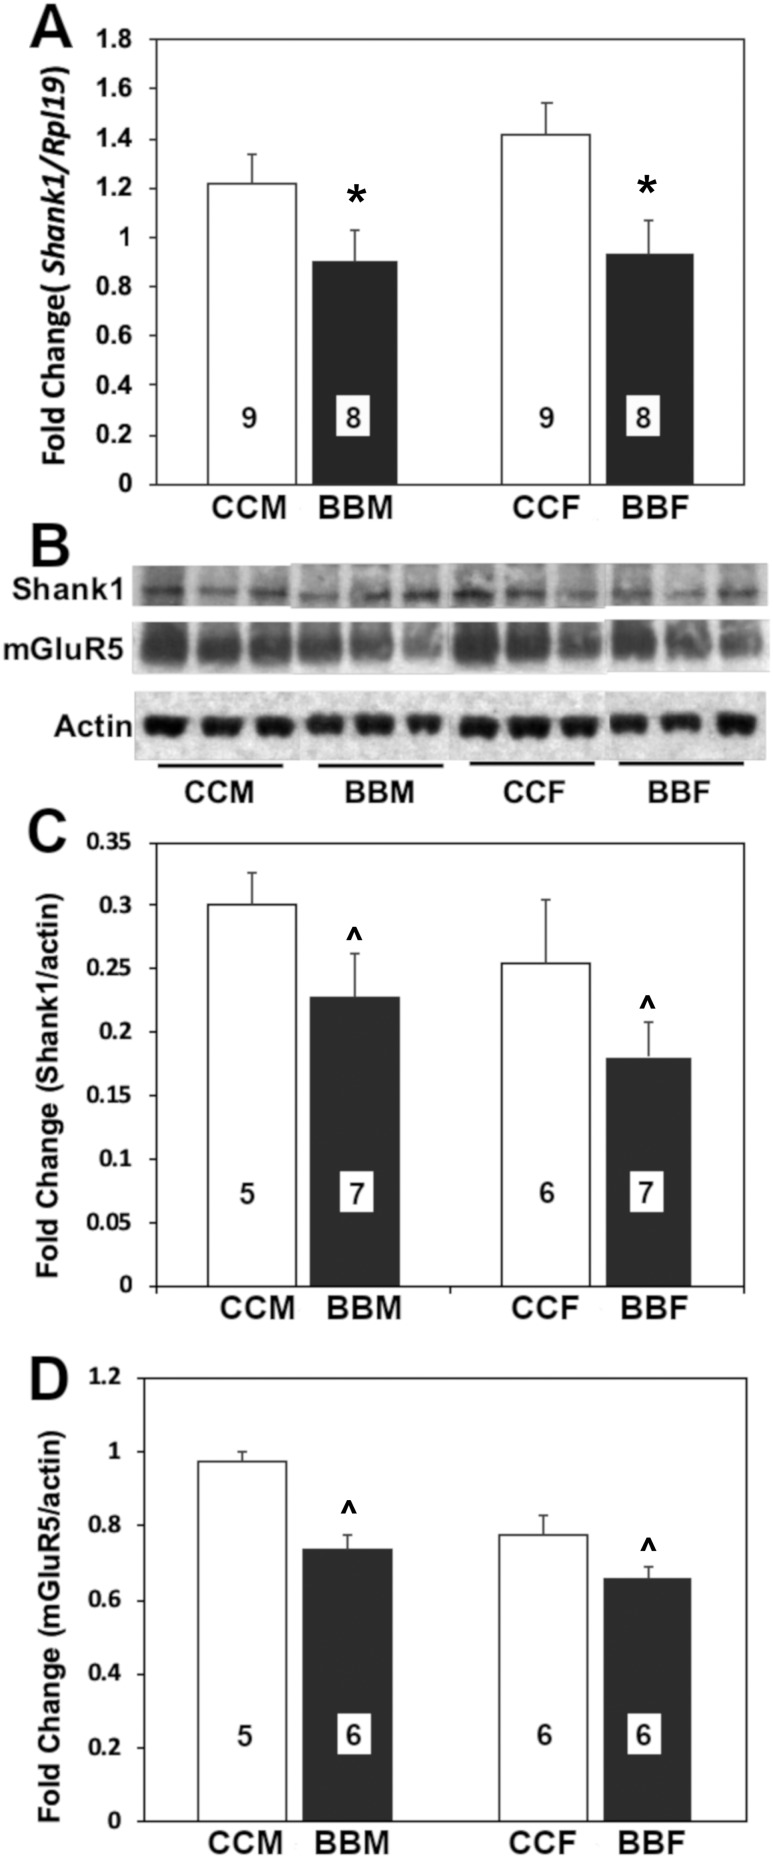
Figure 3.
Mean + SEM fold-changes in (A) Shank1 gene expression, (B and C) SHANK1 protein, and (B and D) MGLUR5 from F3 embryonic (E18.5) male (M) and female (F) mice from control or BPA lineage. (A) Control male data were set to 1.0, and other values were normalized; tissue assayed was the hypothalamus. (B‒D) Tissue was from the amygdala. Numbers per group are given in the histograms. ^Trend for a difference by lineage. *Significant difference by lineage, P < 0.05. BBF, BPA lineage female; BBM, BPA lineage male; CCF, control female; CCM, control male.

