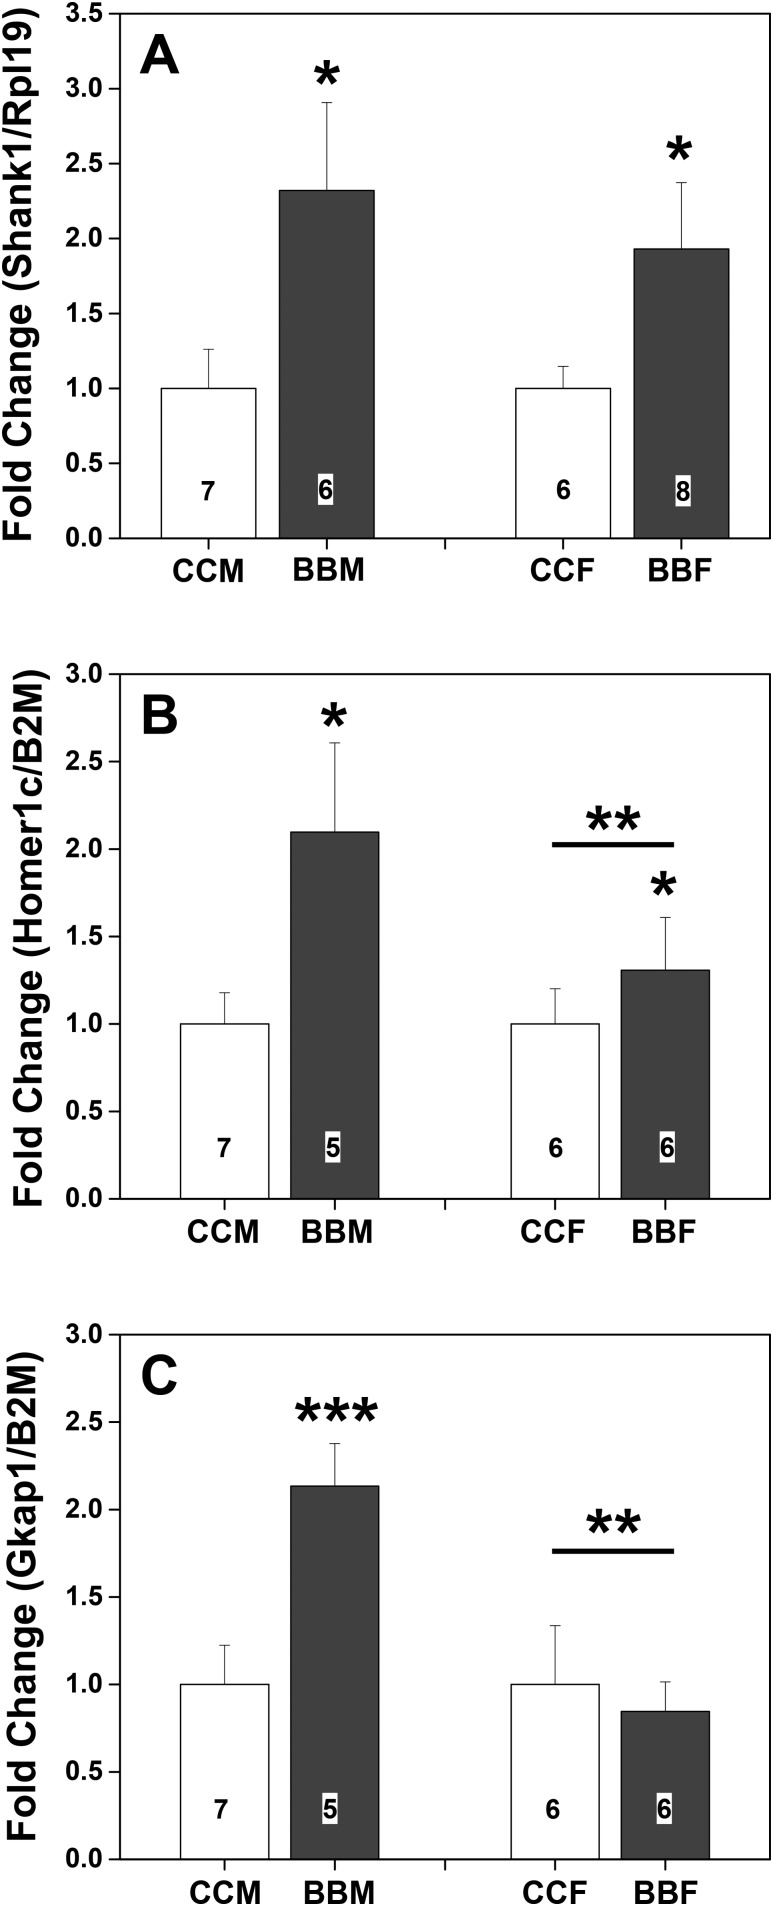
Figure 4.
Mean + SEM fold-changes in gene expression in hypothalami from day of birth (PN0) in F3 male (M) and female (F) mice from control or BPA lineage. (A) Levels of Shank1 RNA. (B) Levels of Homer1c RNA. (C) Levels of Gkap RNA. Control male data were set to 1.0. Numbers per group are given in the histograms. *Significantly different from control lineage. **Significant sex difference. ***Significantly different from all other groups, P < 0.05. BBF, BPA lineage female; BBM, BPA lineage male; CCF, control female; CCM, control male.

