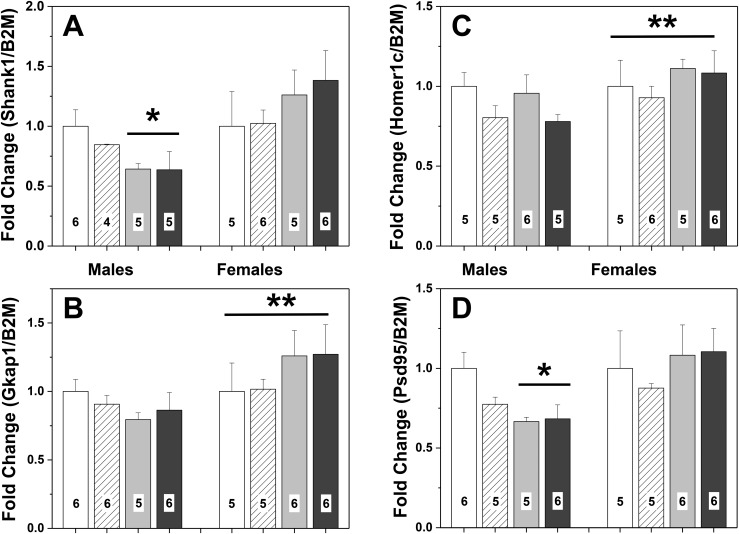
Figure 7.
Mean + SEM fold-changes in gene expression in the lateral septum of F3 mice (PN27) from one of four lineages. (A) Expression levels of Shank1. (B) Expression levels of Gkap. (C) Expression levels of Homer1c. (D) Expression levels of PSD95. Control (CC) male data were set to 1.0. White bars represent data from males and females with control dams and sires (CC). Striped histograms show data from F3 mice that had dams from the control lineage and sires from the BPA lineage (CB). Gray histograms represent data from F3 mice with BPA-lineage dams and control sires (BC). Black bars show data from F3 mice with both parents from the BPA lineage (BB). Numbers per group are given in the histograms. *Significant effect of maternal lineage in males. BC and BB < CC and CB. BC and BB lineages are less than males from CC and CB lineages, P < 0.05. **Significant sex difference, P < 0.03.

