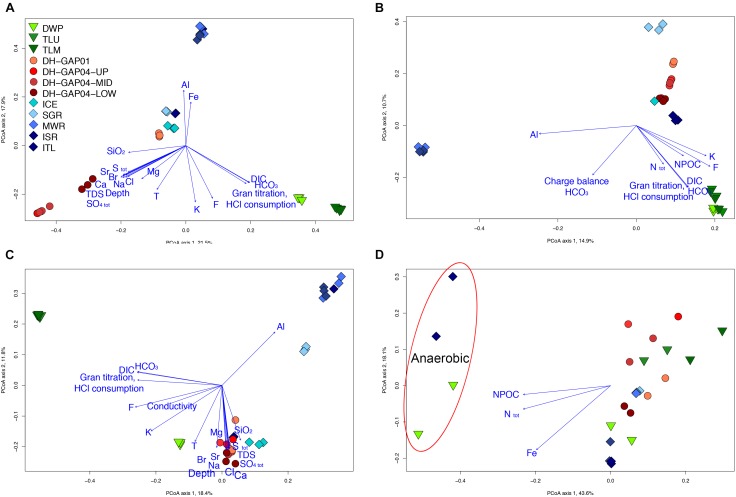
FIGURE 4.
Principal coordinates analysis plots of the (A) bacterial, (B) archaeal, (C) fungal communities, and (D) the hydrolysis patterns of substrates in the Biolog AN tests. The key to the samples in all figures is found in A. In D, the anaerobic Biolog AN tests are indicated with a red oval in the upper left quadrant. Only physicochemical parameters with p < 0.0001 (A–C) and p < 0.001 (D) were plotted.

