Figure 3.

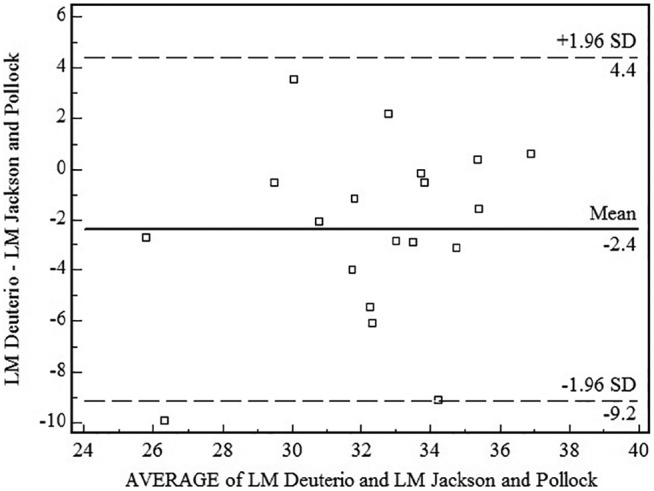
Bland–Altman graph for lean mass (LM) determined by the deuterium oxide method and by the Durnin and Womersley equation.17

Bland–Altman graph for lean mass (LM) determined by the deuterium oxide method and by the Durnin and Womersley equation.17