Figure 3.

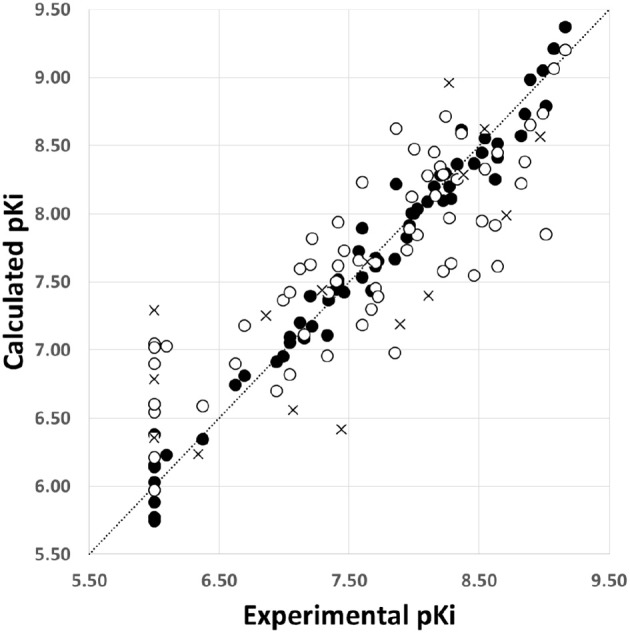
Scatter plot of the experimental activities vs. predicted activities for the model SE: (•) training set predictions, (°) LOO cross-validation predictions, and (×) test set predictions.

Scatter plot of the experimental activities vs. predicted activities for the model SE: (•) training set predictions, (°) LOO cross-validation predictions, and (×) test set predictions.