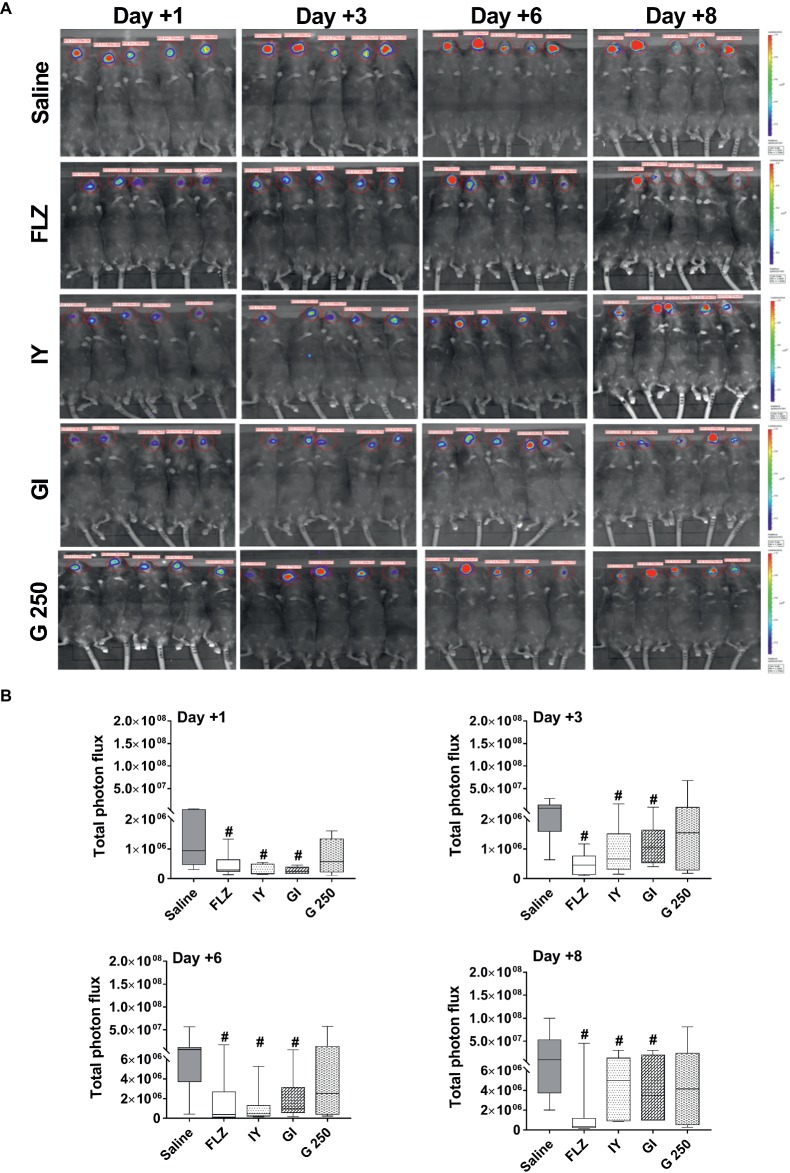
Figure 1.
In vivo imaging of mice orally infected with BLI-C. albicans and treated with FLZ, IY, GI, or G 250. Mice were infected with BLI-C. albicans (1 × 10⁶ CFU/ml) and treated sublingually with 10 μl of saline, FLZ (4 mg/ml), IY, GI, or G 250 (all 100 mg/ml). At 1, 3, 6, and 8 days post-infection anesthetized mice were treated sublingually with 10 μl of coelenterazine (0.5 mg/ml) and imaged in the Lumina XRMS Imaging system. Images are representative of two separate experiments with similar results. (A) Total photon flux emission from oral within the images (Region Of Interest, ROI) of each mouse was quantified with Living Image R software package. (B) Quantification of Total photon flux emission from ROI. Data are from two different experiments each with n = 5 mice/group. The boxplot graphics show median including the 25th and 75th percentile. #p < 0.05 FLZ or compound-treated infected mice vs. saline-treated infected mice.

