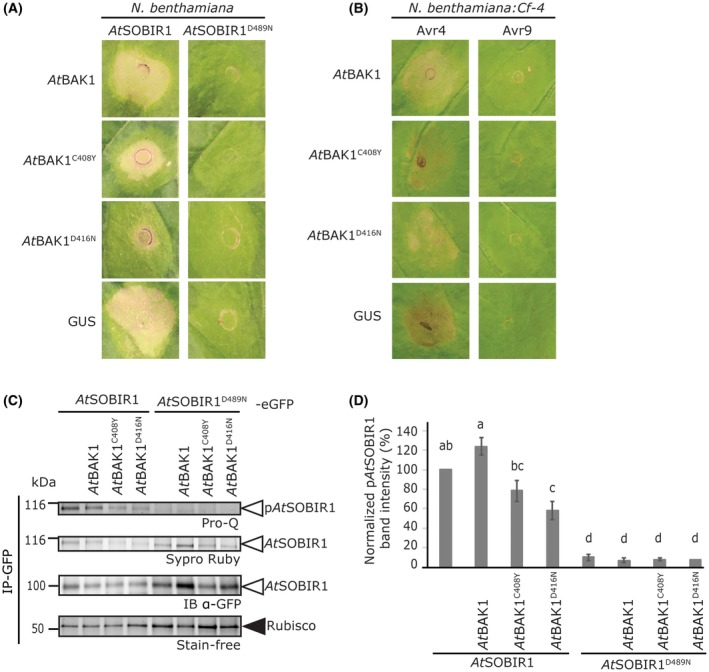
Figure 4.

SOBIR1‐mediated immunity is dependent on kinase‐active BAK1. (A) Transient co‐expression of AtSOBIR1 with the AtBAK1C408Y or AtBAK1D416N mutant results in reduced AtSOBIR1 constitutive immune activity, when compared with co‐expression with wild‐type AtBAK1 or β‐glucuronidase (GUS). The indicated constructs were agroinfiltrated in N. benthamiana at an OD600 of 0.5, with co‐infiltration of P19 at an OD600 of 1. Photographs were taken at 3 dpi, and are representative of two repetitions, with eight agroinfiltrated leaves per sample. (See also Fig. S3A,B.) (B) Transient co‐expression of Avr4 in N. benthamiana:Cf‐4 with the mutants AtBAK1C408Y or AtBAK1D416N results in reduced Cf‐4/Avr4 HR, when compared with co‐expression with wild‐type AtBAK1 or GUS. The indicated constructs were agroinfiltrated at an OD600 of 0.5, with co‐infiltration of Avr4 or Avr9 at an OD600 of 0.03. Photographs were taken at 3 dpi, and are representative of three repetitions, with agroinfiltration of at least six leaves per sample. (See also Fig. S3C.) (C) Phosphorylation of AtSOBIR1 is dependent on kinase‐active BAK1. The indicated eGFP‐tagged AtSOBIR1 and untagged BAK1 constructs were co‐agroinfiltrated at an OD600 of 0.5, in combination with P19 at an OD600 of 1. At 2 dpi, leaves were harvested and subjected to immunoprecipitation (IP) using GFP‐affinity beads, and proteins were subsequently detected by anti‐GFP immune blotting (IB) and Pro‐Q stain. The ribulose‐1,5‐bisphosphate carboxylase/oxygenase (Rubisco) background band of the IP samples is depicted to show equal loading. The experiment was performed twice, and representative results are shown. (D) Quantification of the band intensity of phosphorylated AtSOBIR1 as shown in (C). Ratios were obtained by dividing the band intensity of pAtSOBIR1 from Pro‐Q staining by the band intensity reflecting the total amount of immunoprecipitated AtSOBIR1 in Sypro Ruby staining. Data are presented as the mean ± standard error (SE). The band intensity of the control sample, expression of AtSOBIR1 without co‐expression of BAK1, was set at 100%. The letters indicate significant differences at P < 0.05, as determined by one‐way analysis of variance (ANOVA), including a Tukey post hoc test. [Colour figure can be viewed at wileyonlinelibrary.com]
