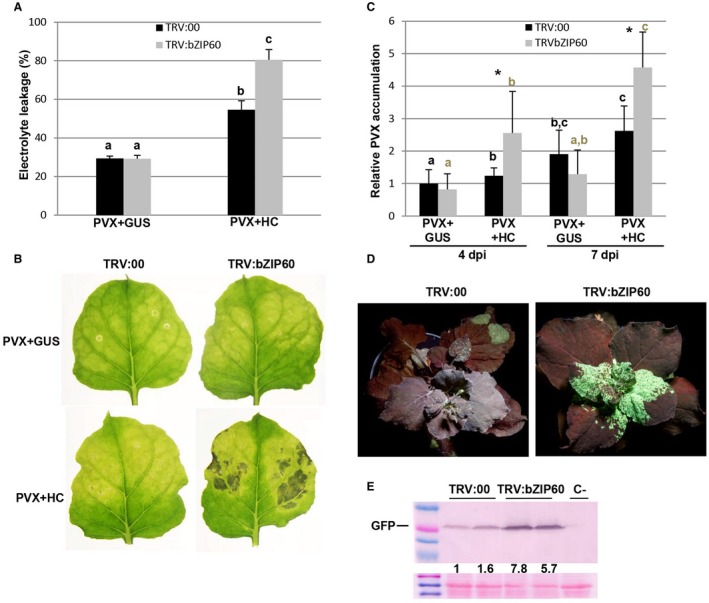
Figure 9.

Enhanced cell death in bZIP60‐silenced plants infected with Potato virus X (PVX) plus helper component‐proteinase (HC‐Pro). Nicotiana benthamiana leaves were infiltrated with Agrobacterium cultures expressing pTRV2:bZIP60 or pTRV2:00 (vector control). (A) Twenty days after inoculation, leaves of pTRV2:bZIP60 and control plants were agroinfiltrated with combinations of PVX together with HC‐Pro or β‐glucuronidase (GUS). Leaf discs from bZIP60‐silenced and control leaves were excised and assayed for electrolyte leakage at 8 days post‐infiltration (dpi). Data represent the means ± standard errors of six replicates, each consisting of four plants that received the same treatment. Statistically significant differences between means were determined by employing Scheffé’s multiple range test. Different letters indicate significant differences at P < 0.05. (B) Representative leaves were photographed at 10 dpi. (C) Quantitative reverse transcription‐polymerase chain reaction (qRT‐PCR) was used to analyse the accumulation of PVX genomic RNA levels in leaf patches infected with PVX at 4 and 7 dpi. Expression of the 18S rRNA gene served as a control. Data represent the means ± standard errors of six replicates, each consisting of two plants that received the same treatment. Statistical comparisons between means were made by employing Scheffé’s multiple range test for between‐group comparisons. Different letters indicate significant differences at P < 0.05. For pairwise comparisons, asterisks indicate significant differences between treatments (Student’s t‐test, P < 0.05). (D) bZIP60‐silenced and control plants were agroinfiltrated with PVX‐GFP (green fluorescent protein). Photographs were taken with long‐wavelength UV light at 8 dpi. (E) Western blot analysis of extracts derived from systemic leaves at 8 dpi, using antibodies against GFP. Two independent pooled samples were analysed, each consisting of two plants that received the same treatment. The lower panel shows the Ponceau S‐stained membrane after blotting, as a loading control. The intensity of the GFP bands, normalized for the loading controls, was quantified by densitometric analysis. [Colour figure can be viewed at wileyonlinelibrary.com]
