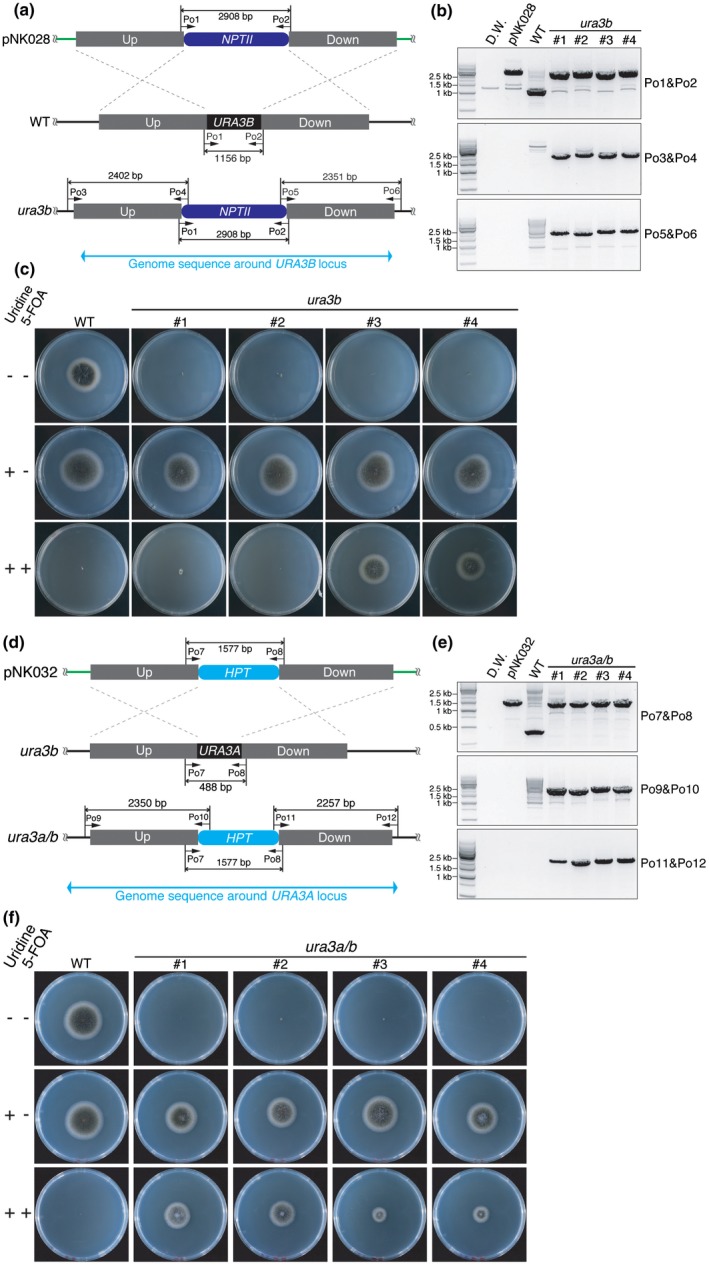
Figure 2.

URA3A and URA3B double knockout mutants show uridine auxotrophy and 5‐fluoroorotic acid (5‐FOA) insensitivity. (a) Schematic diagrams of URA3B (Cob_03887) knockout in Colletotrichum orbiculare 104‐T wild‐type (WT) strain. The pNK028 plasmid contains 2 kb of upstream (Up) and downstream (Down) sequences of the URA3B coding sequence (CDS). The neomycin phosphotransferase II (NPTII) expression cassette is located between the Up and Down sequences as a selection marker against G418. Black arrows represent primers used for genomic DNA polymerase chain reaction (PCR). (b) Genomic DNA PCR showed that URA3B was knocked out. The primer set Po1/Po2 generates 2908‐ and 1156‐bp amplicons from the genome of WT and ura3b, respectively. The primer sets Po3/Po4 and Po5/Po6 generate 2402‐ and 2351‐bp bands from the genome of ura3b, but not from that of WT. (c) WT and four independent ura3b strains were cultured on potato dextrose agar (PDA), PDA with 10 mm uridine and PDA with 10 mm uridine and 1 mg/mL 5‐FOA for 6 days at 25 °C in the dark. (d) Schematic diagrams of URA3A (Cob_06825) knockout in ura3b. The pNK032 plasmid includes the 2‐kb upstream (Up) and downstream (Down) sequences of the URA3A locus. The Down sequence partially includes the 3′‐end of the URA3A CDS. The hygromycin phosphotransferase (HPT) expression cassette is located between the Up and Down sequences as a selection marker against hygromycin. (e) Genomic DNA PCR showed that URA3A was knocked out, resulting in ura3a/b double mutants. ura3a/b#1‐2 and ura3a/b#3‐4 are descendants of ura3b#3 and ura3b#2, respectively. The primer set Po7/Po8 generates 488‐ and 1577‐bp amplicons from the genome of WT (or ura3b) and ura3a/b, respectively. The primer sets Po9/Po10 and Po11/Po12 generate 2350‐ and 2257‐bp bands from the genome of ura3a/b, but not from that of WT (or ura3b). The primers used are listed in Table S3 (see Supporting Information). (f) The same experiment as described in (c) was performed. Details of each strain are listed in Table S1 (see Supporting Information). [Colour figure can be viewed at wileyonlinelibrary.com]
