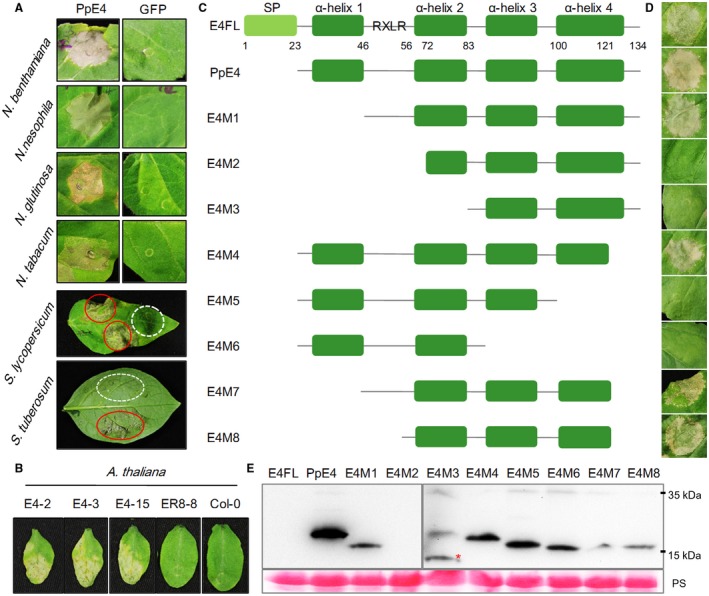
Figure 6.

Analysis of cell death triggered by PpE4. (A) Cell death phenotype induced by PpE4 in Solanaceae plants. Agrobacterium tumefaciens carrying PpE4 [optical density at 600 nm (OD600) = 0.4] was infiltrated into the leaves of Nicotiana benthamiana, N. nesophila, N. glutinosa, N. tabacum cv. Florida 301, Solanum lycopersicum and S. tuberosum. Photographs were taken at 5 days post‐infiltration (dpi) for Nicotiana species and 8 dpi for Solanum species. Red circles represent the PpE4‐expressing areas, and white broken circles represent the GFP‐expressing areas. (B) Cell death symptoms triggered by PpE4 in Arabidopsis. Leaves of transgenic Arabidopsis plants harbouring pER8::3×Flag‐PpE4 or the empty vector and Col‐0 were injected with 10 μM 17‐β‐estradiol. Photographs were taken after 5 days. (C) Schematic diagrams of the protein secondary structures of the PpE4 deletion mutants. (D) Cell death symptoms in N. benthamiana leaves expressing PpE4 deletion mutants. Photographs were taken at 5 dpi. (E) Western blot detection of PpE4 deletion proteins using anti‐Flag antibody. The red asterisk indicates a protein band of the correct size. Protein loading is indicated by Ponceau stain (PS). Similar results were obtained from three independent experiments. [Colour figure can be viewed at wileyonlinelibrary.com]
