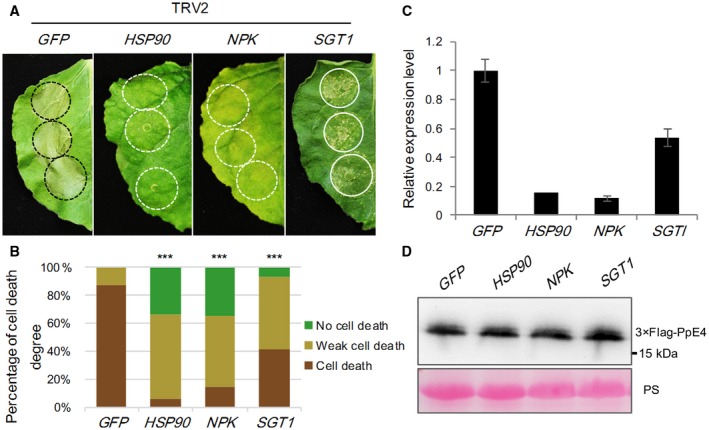
Figure 7.

HSP90, NPK and SGT1 are involved in PpE4‐induced cell death. (A) Representative images of PpE4‐induced cell death in silenced Nicotiana benthamiana leaves at 5 days post‐infiltration (dpi). PpE4 was transiently expressed in the upper leaves of silenced plants at 16–20 dpi of TRV constructs. (B) Quantification of cell death in N. benthamiana leaves scored at 5 dpi. The degree of cell death was divided into three levels: no cell death, weak cell death and complete cell death. Asterisks indicate significant differences from GFP‐silenced plants (Wilcoxon rank‐sum test: ***P < 0.001). (C) Relative expression levels of HSP90, NPK and SGT1 transcripts in corresponding virus‐induced gene silencing (VIGS)‐treated plants determined by reverse transcription‐quantitative polymerase chain reaction (RT‐qPCR). Error bars represent the standard deviation (SD) of three biological replicates. (D) Detection of PpE4 protein accumulation in silenced leaves using the anti‐Flag antibody. Protein loading is indicated by Ponceau stain (PS). Similar results were obtained from more than three independent experiments with 10 plants for each TRV construct. [Colour figure can be viewed at wileyonlinelibrary.com]
