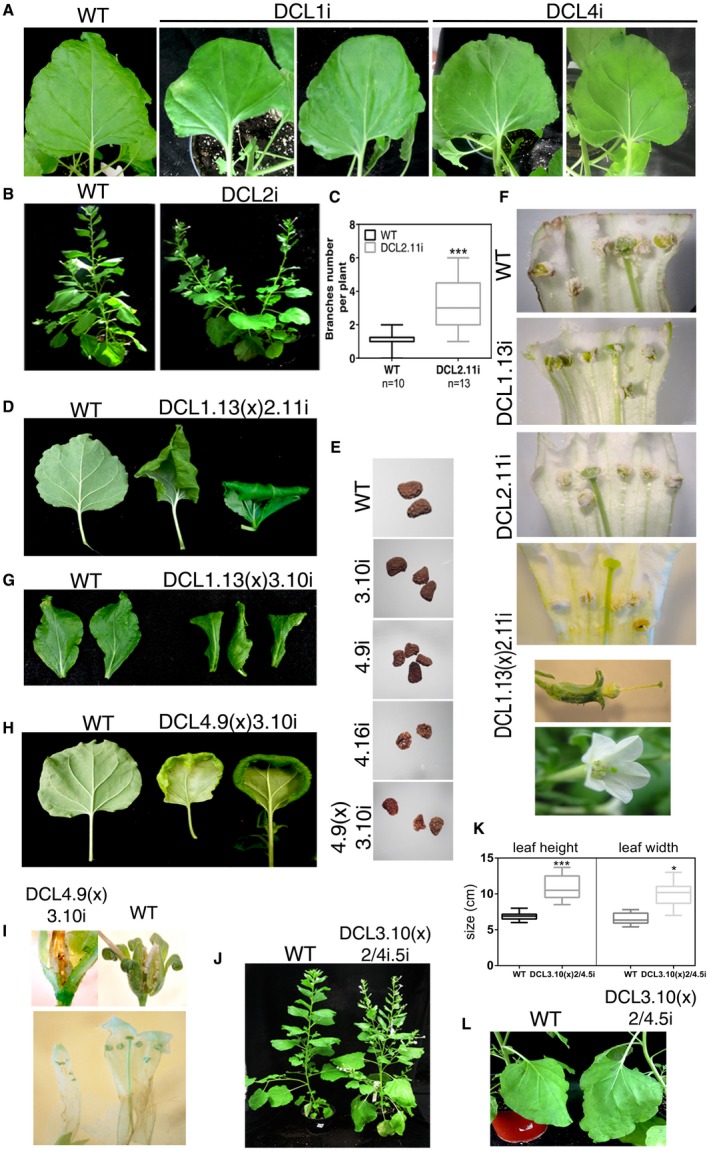
Figure 1.

Phenotypic analysis of DCLi and DCLi crossed plants. (A, D, G, H) Leaves of wild‐type (WT), DCL1i, DCL4i, DCL1.13(x)2.11i, DCL1.13(x)3.10i and DCL4.9(x)3.10i plant lines. (B, J, L) Photographs of WT, DCL2i, DCL3.10(x)2/4.5i plant lines. (E) Photographs of seeds from WT, DCL3.10i, DCL4.9i, DCL4.16i and DCL4.9(x)3.10i plant lines. (F, I) Flowers of WT, DCL1.13i, DCL2.11i, DCL1.13(x)2.11i and DCL4.9(x)3.10i plant lines. (C, K) Graph representing the branch numbers of DCL2i and leaf height/width (cm) measurements of DCL3.10(x)2/4.5i plants (leaf number 8 in plants at the stage of 12 leaves). Unpaired Student’s t‐test was performed with ***P < 0.001 and *P < 0.05. [Colour figure can be viewed at wileyonlinelibrary.com]
