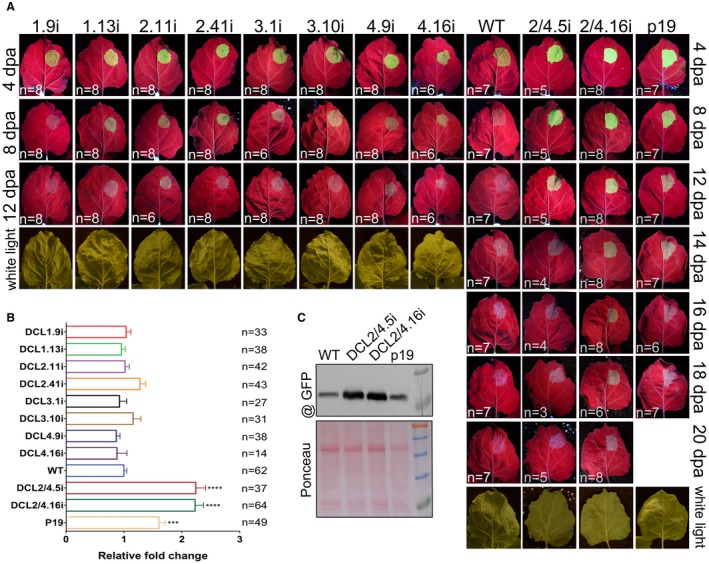
Figure 3.

Green fluorescent protein (GFP) expression in DCLi plant lines. (A) Photographs of GFP agroinfiltrated leaves under UV or white light at different time points. ‘n’ corresponds to the number of leaves with the same GFP intensity as in the presented photograph. DCLi plants are at the F7 generation, apart from DCL3.1i and DCL3.10i, which are at the F4 generation. (B) Measurement of GFP in DCLi plant line total protein extracts at 4 days post‐agroinfiltration (dpa). ‘n’ corresponds to the number of individual leaves tested. One‐way analysis of variance (ANOVA) test was performed with ****P < 0.0001 and ***P < 0.001. (C) Western blot analysis for GFP detection in wild‐type (WT), DCL2/4i and P19 plant lines. Ponceau staining was used as loading control. [Colour figure can be viewed at wileyonlinelibrary.com]
